Weather call · Truckee
Loading forecast...
—
☁
GoCautionNo-go
FIELD INTEL
—°F
Hi / Lo
—
Precip
—
Wind
—
Humidity
—
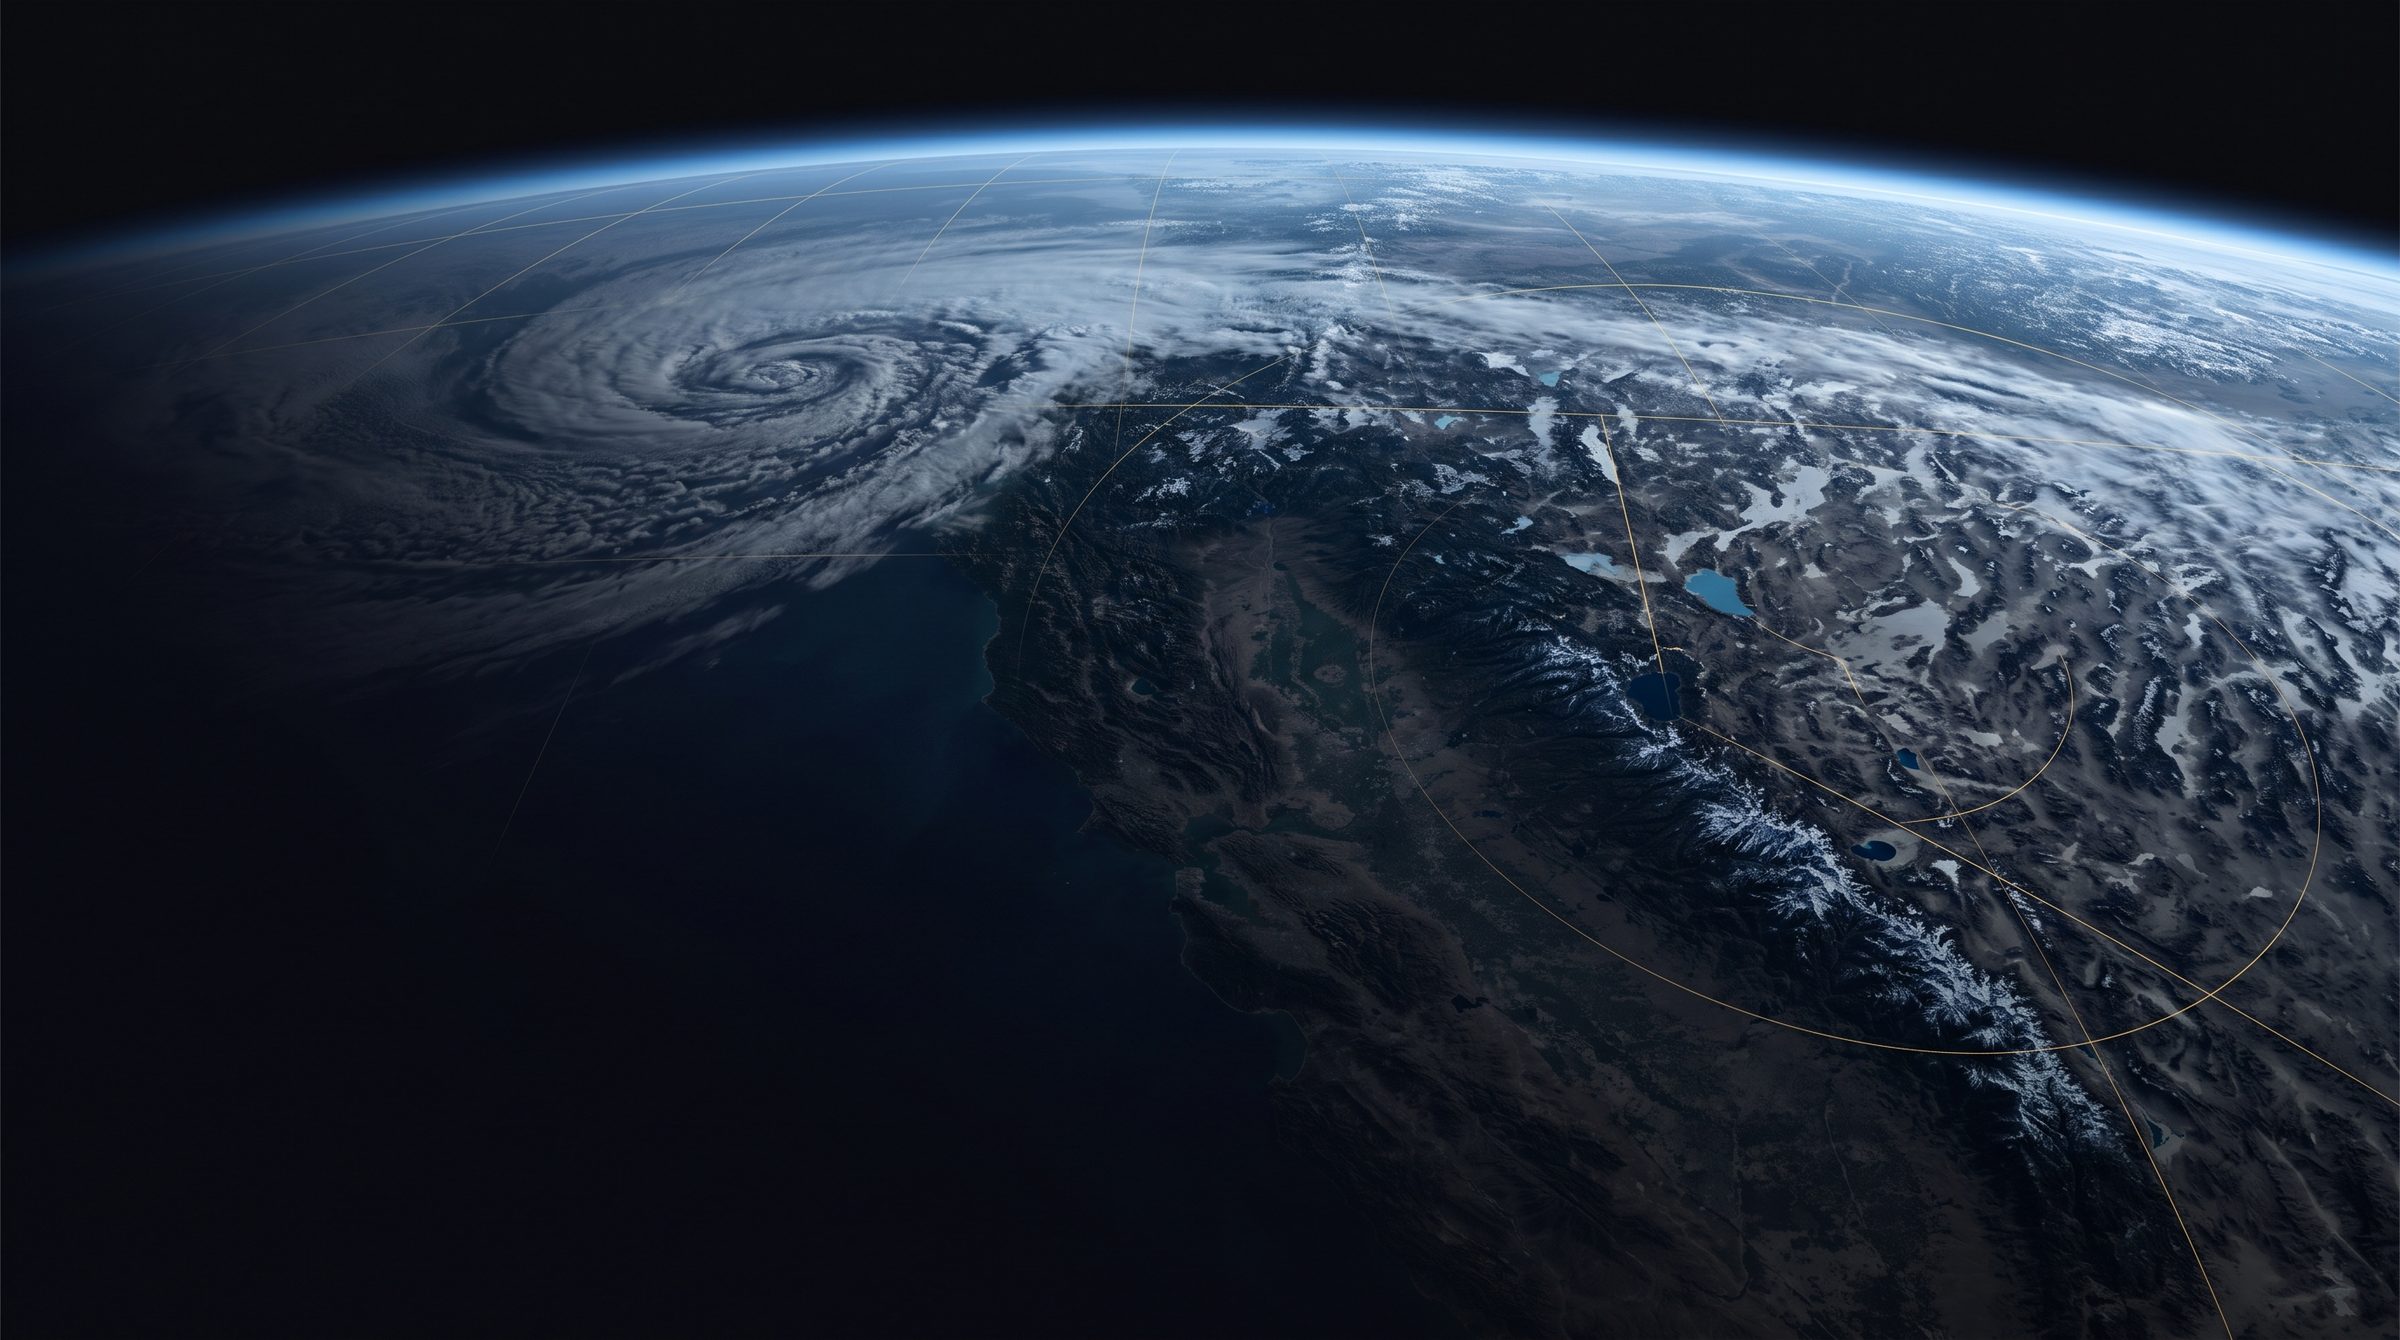
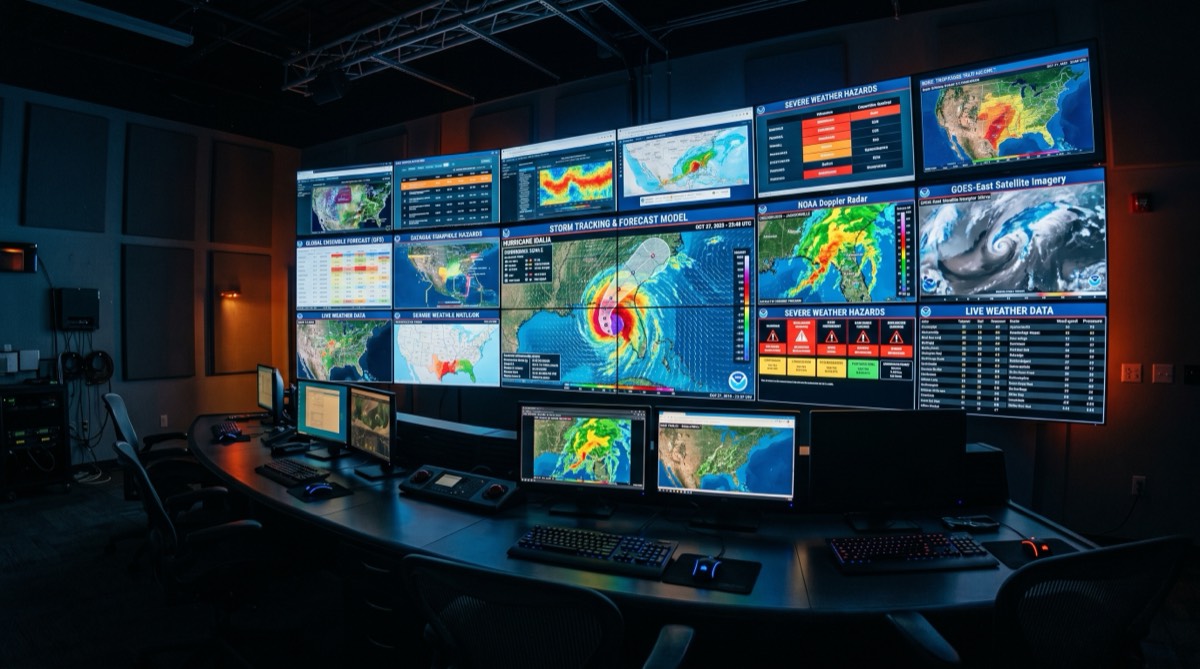
From orbit to the jobsite. Satellite, upper air, radar, eight forecast models and every live ground station nearby, blended every time this page loads and checked against what actually happened.
Writing today's note from live conditions…
Truckee, California sits in a unique geographic pocket where the eastern slope of the Sierra Nevada meets the high desert of the Great Basin. At 5,817 feet above sea level, the town straddles a meteorological boundary that produces some of the most dynamic weather in the western United States. Storms arriving from the Pacific Ocean climb the western Sierra slopes, dropping enormous amounts of precipitation as they ascend, then barrel through Donner Pass and into the Truckee basin with force that can catch anyone unprepared.
This is not a place where you check the forecast once and call it good. Truckee weather demands attention. Clear morning skies can give way to afternoon thunderstorms in summer, and winter systems can stack up back-to-back for weeks, burying the town under feet of snow. Anyone who works outdoors here, from excavation crews to ski patrol, knows that mountain weather makes its own rules.
At nearly 6,000 feet, Truckee experiences weather patterns that bear little resemblance to what happens in Sacramento or the Bay Area just hours away. The elevation drives several key effects: temperatures drop roughly 3.5°F for every 1,000 feet of elevation gain, meaning Truckee runs 15-20 degrees cooler than the valley floor on any given day. UV intensity increases about 6-8% per 1,000 feet, making sun protection critical even during cold months. And the thin mountain air loses heat rapidly after sunset, producing daily temperature swings of 40°F or more in summer.
The elevation also determines precipitation type. Rain/snow lines in the Sierra frequently hover right around Truckee's altitude, meaning the same storm system can deliver rain, sleet, or heavy snow depending on minor temperature fluctuations. Our full weather platform tracks these transitions in real time so you know exactly what to expect on the ground.
The Sierra Nevada range creates one of the most dramatic weather boundaries in North America. Pacific moisture-laden air is forced upward by the mountain wall, cooling as it rises and releasing precipitation on the western slopes. Truckee, sitting just east of the crest near Donner Summit, receives the tail end of this orographic lift. Average annual snowfall in town is around 200 inches, though nearby Donner Summit regularly sees 400 inches or more. This persistent snowpack feeds the Truckee River and supplies water to communities downstream all the way to Reno.
The Sierra climate also produces strong temperature inversions during winter, where cold air pools in the valley while warmer air sits above. These inversions can trap fog and ice in the Truckee basin for days, creating hazardous driving conditions on I-80 and local roads. Check our storm tracker before heading out during winter months.
Winter in Truckee (November through April) is defined by Pacific storm cycles. Atmospheric rivers, the long plumes of subtropical moisture that stream across the Pacific, are the primary drivers of major snow events. A single atmospheric river event can dump 3-5 feet of snow on Truckee in 48 hours. Between storm cycles, high pressure systems bring bluebird skies and bitter cold, with overnight lows regularly dropping below zero in January and February.
Summer (June through September) brings warm, dry days and the threat of afternoon thunderstorms. Monsoonal moisture can push north from the Desert Southwest, triggering convective storms that produce lightning, gusty winds, and brief but intense downpours. Keeping tabs on thunderstorm development is critical. Our crew weather tool provides field-ready forecasts built specifically for outdoor work.
Spring and fall are transition seasons where anything goes. April snowstorms are common. October can deliver summer-like warmth or early winter conditions. The unpredictability makes reliable forecasting essential for anyone living or working in the area.
Single-model weather forecasts fail in mountain terrain. That is not opinion, it is physics. Mountain weather is governed by microclimates, elevation gradients, and terrain-forced interactions that no single model captures well. That is why this platform blends eight models: the European ECMWF and its AI version, the American GFS, the German ICON, the Japanese JMA, the Canadian GEM, the British UKMO and the Chinese CMA, with the high-resolution short-range HRRR model layered over the first 18 hours.
The blend is not a simple average. Every day each model is scored against what the Truckee Tahoe Airport station actually recorded, for highs, lows, wind and gusts, at every lead from one day out to seven. The models that verify best for Truckee earn more weight, each model's local bias is corrected, and a change to the weights only goes live when it beats the old weights on days it has never seen. Those scores are published on the Accuracy tab, so you can check the forecast's record before you trust it.
Truckee's valley floor, Donner Summit, the lake shore and the ridge tops rarely read the same number. The platform pulls about 130 live instruments around Truckee, from the airport and the mountain passes to school and backyard stations, measures how temperature changes with elevation right now, and uses that to correct the first 24 hours of the forecast for your spot. The station panel shows every reading on the map. Browse field-tested weather gear at our Amazon storefront to make sure you are prepared for whatever the forecast says is coming.
Mountain weather forecasting is one of the hardest problems in meteorology. Terrain forces air to rise, sink, channel, and eddy in ways that global weather models, which operate on grid cells measured in kilometers, simply cannot resolve. A ridge that diverts wind, a canyon that funnels cold air, a south-facing slope that heats faster than a north-facing one: these local effects dominate the weather experience at ground level but are invisible to coarse-resolution models.
Truckee compounds this challenge by sitting in a valley surrounded by mountains on all sides, creating inversions, drainage flows, and convergence zones that shift with every change in wind direction. Cloud bases in the Sierra can sit right at Truckee's elevation, meaning the town can be socked in fog while locations just a few hundred feet higher bask in sunshine. The only way to handle this level of complexity is high-resolution data, multiple models, and continuous verification against real observations. That is exactly what the ensemble approach on this platform delivers. For cold weather gear built to handle Sierra conditions, check the storefront.
Check tonight's low first. The forecast above shows the overnight low. 32 degrees or colder is a freeze.
Truckee sits at about 5,817 feet in a basin. On clear, calm nights the ground loses heat to the sky and the coldest air drains downhill and settles on the valley floor and along the Truckee River. That is why the low can come in several degrees under the daytime forecast, and why a frost can show up here weeks before it reaches lower elevations. Clouds, wind and a wet snowpack all hold temperatures up; clear skies and dry air let them fall.
| Overnight low | What to expect |
|---|---|
| 33 to 36 F | Frost possible on grass, car windows and rooftops under clear, calm skies. |
| 32 F or below | Freeze. Tender plants, hoses and exposed irrigation are at risk. Wet pavement can ice. |
| 25 to 31 F | Hard freeze for gardens. Black ice on bridges, shade and wet roads in the morning. |
| Around 20 F or colder for hours | Pipes in crawl spaces and exterior walls are at risk. Protect plumbing. |
Road surface can freeze when the air reads a few degrees above 32. Bridges, shaded corners and the river canyon freeze first, and melt-and-refreeze cycles make ice most likely between midnight and mid morning. If the low is near or below freezing, assume ice, slow down and leave extra room. For the climb over the summit, see Donner Summit road conditions.
Crews and equipment owners get caught by the first hard freezes. Plug in block heaters where fitted, use winter-grade fluids, park machines on dry ground or planks so tracks do not freeze down, protect water lines and batteries, and follow the manufacturer's cold weather procedures. For go or no-go calls on crew days, see the crew GO/NO-GO explainer and the crew weather page. Equipment questions go through E Kerr LLC equipment rental.
Check the overnight low on the Truckee forecast at errolkerr.com/weather. A low at or below 32 degrees Fahrenheit means a freeze. Truckee sits at about 5,817 feet in a cold air basin, so clear, calm nights run colder than the daytime forecast suggests, and the valley floor and river corridor are usually coldest.
Road surfaces can freeze even when the air reads a few degrees above 32. Bridges, shaded corners, the Truckee River canyon and any wet pavement freeze first, mostly between midnight and mid morning after a clear night or after daytime melt refreezes. When the low is near or below freezing, assume ice on the morning drive.
Let faucets on exterior walls and in unheated spaces drip, open cabinet doors under sinks, disconnect and drain hoses, and keep the heat on in vacant buildings. Pipes are most at risk when lows stay below about 20 degrees for several hours, especially in crawl spaces and outside walls.
Plug in block heaters where fitted, use the right winter diesel and fluids, park machines on dry ground or planks so tracks do not freeze down, drain or protect water lines, and cover batteries. Check with the equipment manufacturer for exact cold weather procedures.
errolkerr.com/weather shows an eight model blend, 22 live Caltrans cameras and the Kerr Storm Tracker, and errolkerr.com/accuracy publishes its own forecast error against the Truckee airport station.
Most radar pages show you the last hour and stop. This one starts with the raw National Weather Service NEXRAD composite, reads it the way a meteorologist does, and tells you where the rain and snow are going next. It was built in Truckee for the excavation crews who have to make a call at dawn, and it is free for anyone who works or plays outside in the Sierra. The same Kerr Map, with its Lightning risk layer, is the primary map on Kerr Weather.
The tracker pulls the national radar composite for the last five hours, converts every pixel back to reflectivity, and animates it. You see the actual returns, not a smoothed picture.
It measures how every storm moved over the last 20 minutes, checks that against the steering wind about 10,000 feet up, and carries the storms forward. Every load grades that projection against the radar that actually arrived; at 30 and 60 minutes it runs about 9 to 12 percent better than assuming storms stay put.
As the projection ages, the high-resolution HRRR and the American GFS take over, out to 48 hours. The point where the hand-off happens is learned from the tracker's own verified runs, not guessed.
National Weather Service storm cell tracks are drawn with each cell's closest approach and estimated arrival at your location, so a crew knows whether a cell is coming to them or passing by.
Every load projects from an older scan and scores that projection against the radar that actually arrived 30 and 60 minutes later. The scores are published on the Accuracy tab, and the tracker only claims skill out to the lead that has verified.
The tracker is additional guidance. National Weather Service warnings and Sierra Avalanche Center forecasts always take priority, and the tracker never tells you a place is safe.
The Sierra Nevada is one of the most meteorologically dynamic mountain ranges on the planet. Stretching over 400 miles along California's eastern spine, the range intercepts moisture-laden Pacific storm systems and forces them skyward in a process called orographic lift. As moist air rises along the western slopes, it cools, condenses, and releases enormous volumes of precipitation. This single mechanism is responsible for the Sierra's reputation as one of the snowiest mountain ranges in the world, regularly burying passes and summit stations under 30 to 50 feet of cumulative snowfall each winter.
Modern storm forecasting in the Sierra relies on ensemble modeling, where multiple weather models run simultaneously to produce a probability-weighted forecast. Our weather platform blends 8 global models (ECMWF IFS, ECMWF AIFS, GFS, ICON, JMA, GEM, UKMO and CMA), with the HRRR layered over the first 18 hours. Several of those models stop around day 7 to 11, so the later days lean on ECMWF, ECMWF AIFS and GFS. By comparing model agreement and divergence, we identify high-confidence storm windows days before they arrive. When 6 or more models converge on a precipitation event, confidence is high. When they diverge, we flag uncertainty so you can plan accordingly.
Donner Pass sits at 7,056 feet along the Sierra crest and serves as the primary weather checkpoint for storms crossing into the Tahoe Basin and points east. Interstate 80 crosses the summit here, making it the most heavily traveled trans-Sierra corridor and the most weather-sensitive. Storms that stall over Donner Pass can dump 3 to 5 feet of snow in 24 hours, closing the highway and stranding travelers. The pass also marks a critical elevation threshold: storms with snow levels above 7,000 feet will deliver rain at the summit, while those below 6,000 feet produce the heaviest accumulations. Monitoring Donner Pass conditions is essential for anyone working, traveling, or recreating in the northern Sierra.
The most powerful storms to hit the Sierra are atmospheric rivers, narrow corridors of concentrated moisture that can stretch from the tropics to Northern California. When an atmospheric river makes landfall aimed at the Sierra, the results are staggering. Integrated water vapor transport values above 500 kg/m/s deliver multi-day precipitation events capable of producing 10 or more inches of liquid equivalent. The "Pineapple Express" variant, originating near Hawaii, brings exceptionally warm, moisture-rich air that can push snow levels to 8,000 feet or higher before cold air wraps in behind the front. These events produce the Sierra's most extreme flooding and avalanche conditions.
The Sierra Nevada averages 300 to 500 inches of snow annually at elevations above 7,000 feet. Donner Summit, Blue Canyon, and the Lake Tahoe rim consistently rank among the snowiest locations in North America. The winter of 2022-2023 delivered over 700 inches at some Sierra stations, burying structures and breaking modern records. Individual storms have dumped 5 to 10 feet in a single 48-hour window. The orographic enhancement factor means the Sierra receives 3 to 5 times the precipitation of the Sacramento Valley floor just 60 miles to the west.
The Sierra experiences two distinct storm regimes. Winter storms (November through April) are synoptic-scale Pacific systems driven by the jet stream. They bring sustained precipitation, high winds, and heavy snow accumulation over days. These are the storms that close passes and build the snowpack that California depends on for water supply. Summer thunderstorms (June through September) are an entirely different animal. Driven by monsoonal moisture from the Gulf of California and daytime convective heating, these storms build rapidly over the Sierra crest in the afternoon. CAPE values spike, cumulus towers explode to 40,000 feet, and isolated cells produce intense lightning, hail, and localized downpours. Our crew weather dashboard tracks both regimes to keep field crews informed and safe.
Once Pacific moisture crosses the Sierra crest, it descends rapidly into the rain shadow of the eastern slope. Annual precipitation drops from 60+ inches on the western side to under 10 inches in the Owens Valley and Great Basin. This dramatic gradient means storms that deliver heavy snow to Donner Pass may produce nothing at all 30 miles to the east. Understanding this asymmetry is critical for anyone operating on both sides of the range, and it's why granular, location-specific forecasting matters more in the Sierra than almost anywhere else in the country.
The Storm Tracker is errolkerr.com's own future radar for the Sierra Nevada. It reads the raw NEXRAD radar composite for the last five hours, measures how every storm has been moving, and carries that motion forward. As the projection ages it hands off to the HRRR and GFS forecast models, out to 48 hours, and the ECMWF model carries the picture to 10 days. National Weather Service storm cells are drawn with their closest approach and arrival time for your location. A Lightning risk layer shows where thunderstorms can fire, and the same Kerr Map is the primary map on the Kerr Weather storms view.
The timeline runs from five hours in the past to 48 hours ahead. The tracker's own motion projection leads first; each load sets the handoff by grading it against the radar that arrived (at 30 and 60 minutes it runs about 9 to 12 percent better than assuming storms stay put), then the HRRR and GFS models take over. A separate 10 day view uses the ECMWF model through Windy. Only the leads that have verified are presented as skilled.
Every load grades itself. The tracker projects from an older radar scan, compares the projection with the radar that actually arrived 30 and 60 minutes later, and scores the hit rate at 20 and 35 dBZ against simply assuming the storm stayed put. Those scores, and the learned hand-off between the tracker and the models, are published on the Accuracy tab. Official NWS warnings always take priority over anything the tracker shows.
Yes. The map opens on Truckee, California and covers Donner Pass, Lake Tahoe, Reno and the northern Sierra. The weather platform follows the location you set, and the tracker follows the platform, so a crew can point it at any job site in the United States that the NEXRAD network covers.
The Sierra Nevada has two storm seasons. Winter storm season runs November through April, delivering Pacific frontal systems and atmospheric rivers that produce the bulk of annual snowfall. Summer thunderstorm season runs June through September, when monsoon moisture and afternoon heating build storms over the crest.
The Sierra Nevada averages 300 to 500 inches of snow annually at higher elevations. Donner Summit, at 7,056 feet, averages around 400 inches per year. During exceptional atmospheric river events, individual storms can deliver 5 to 10 feet of snow in a few days.

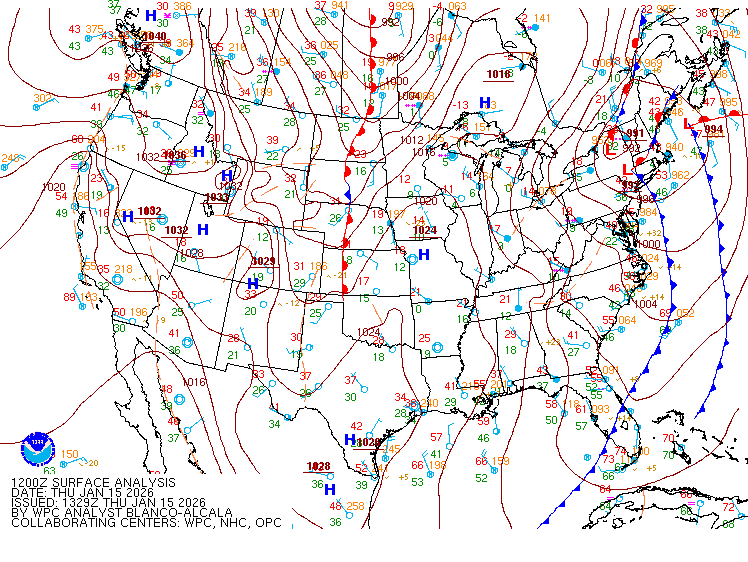
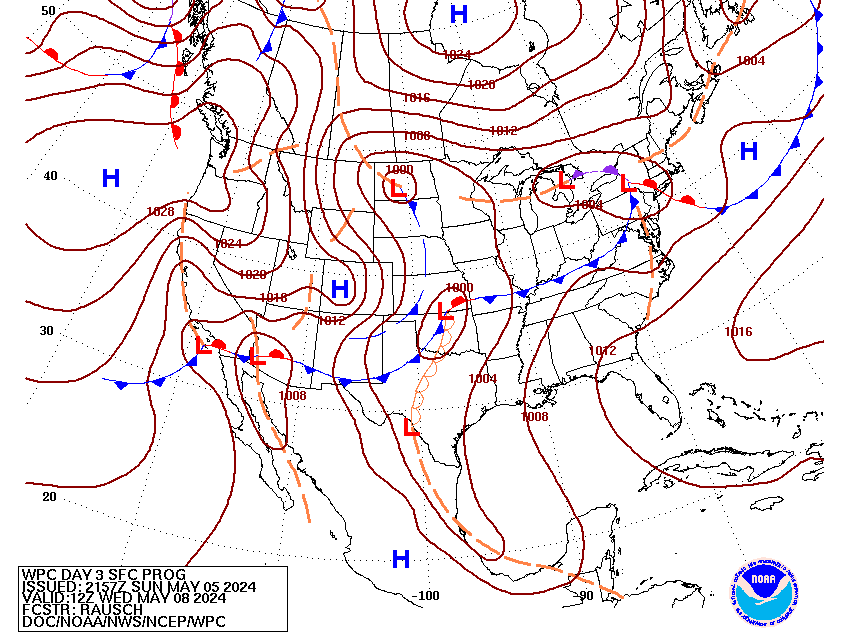

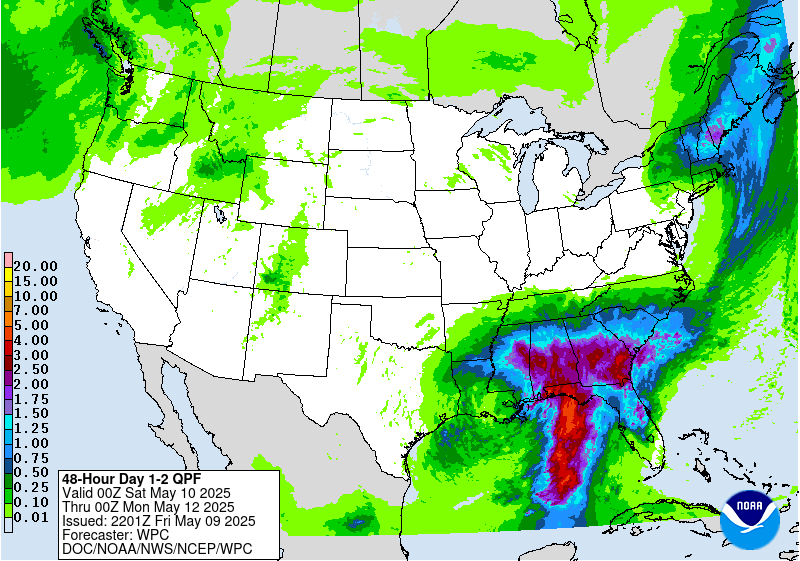
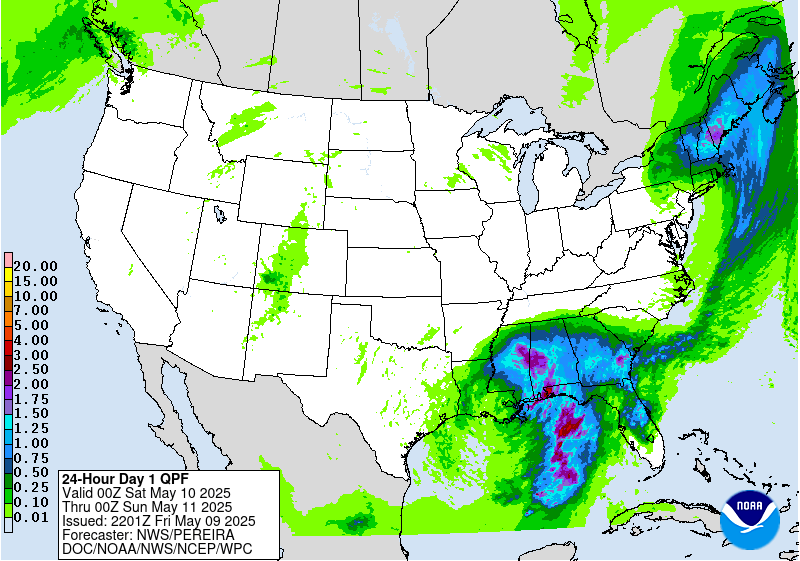
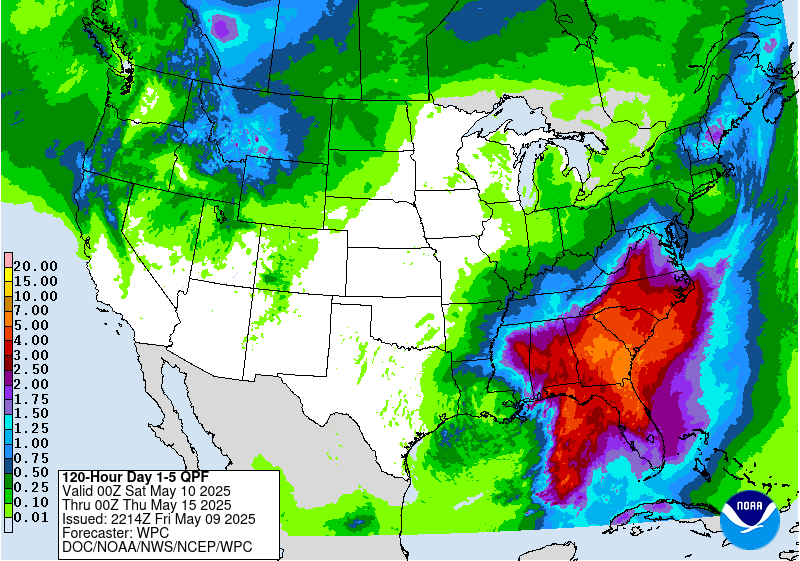
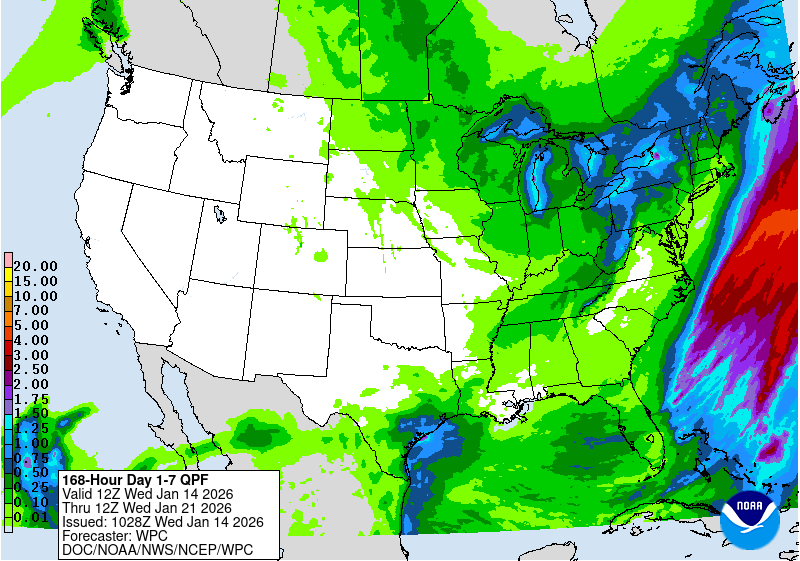


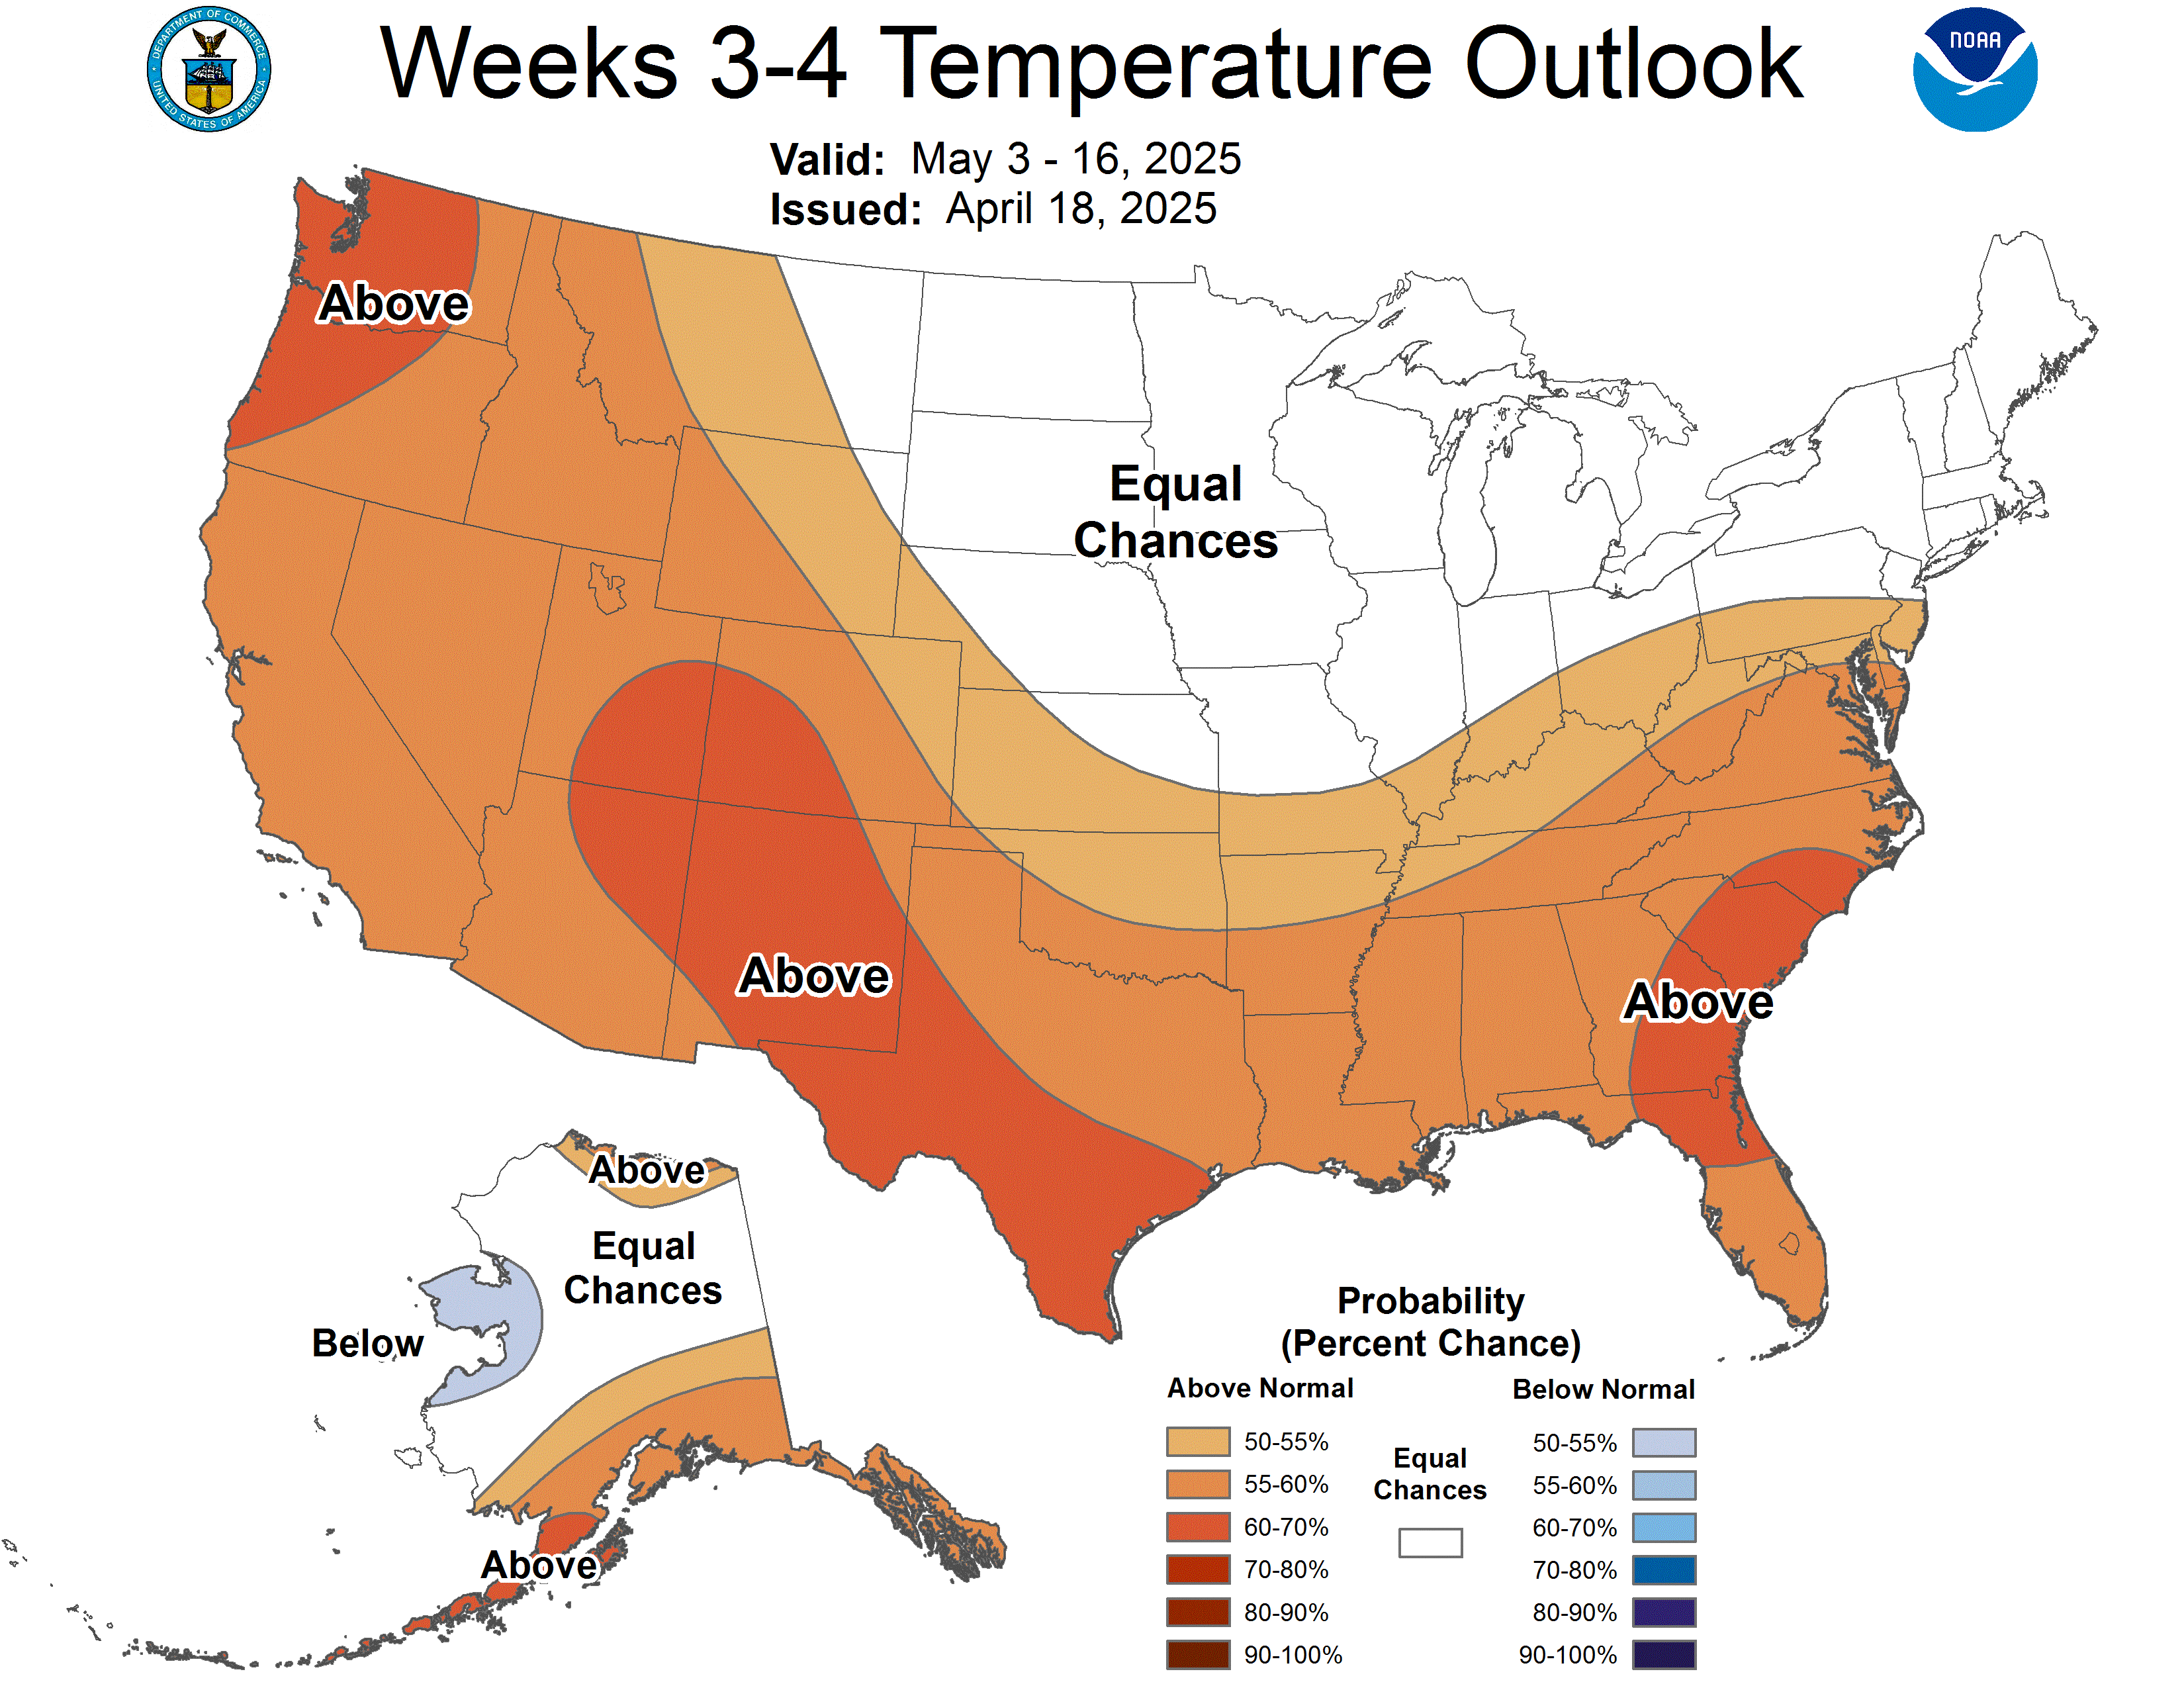
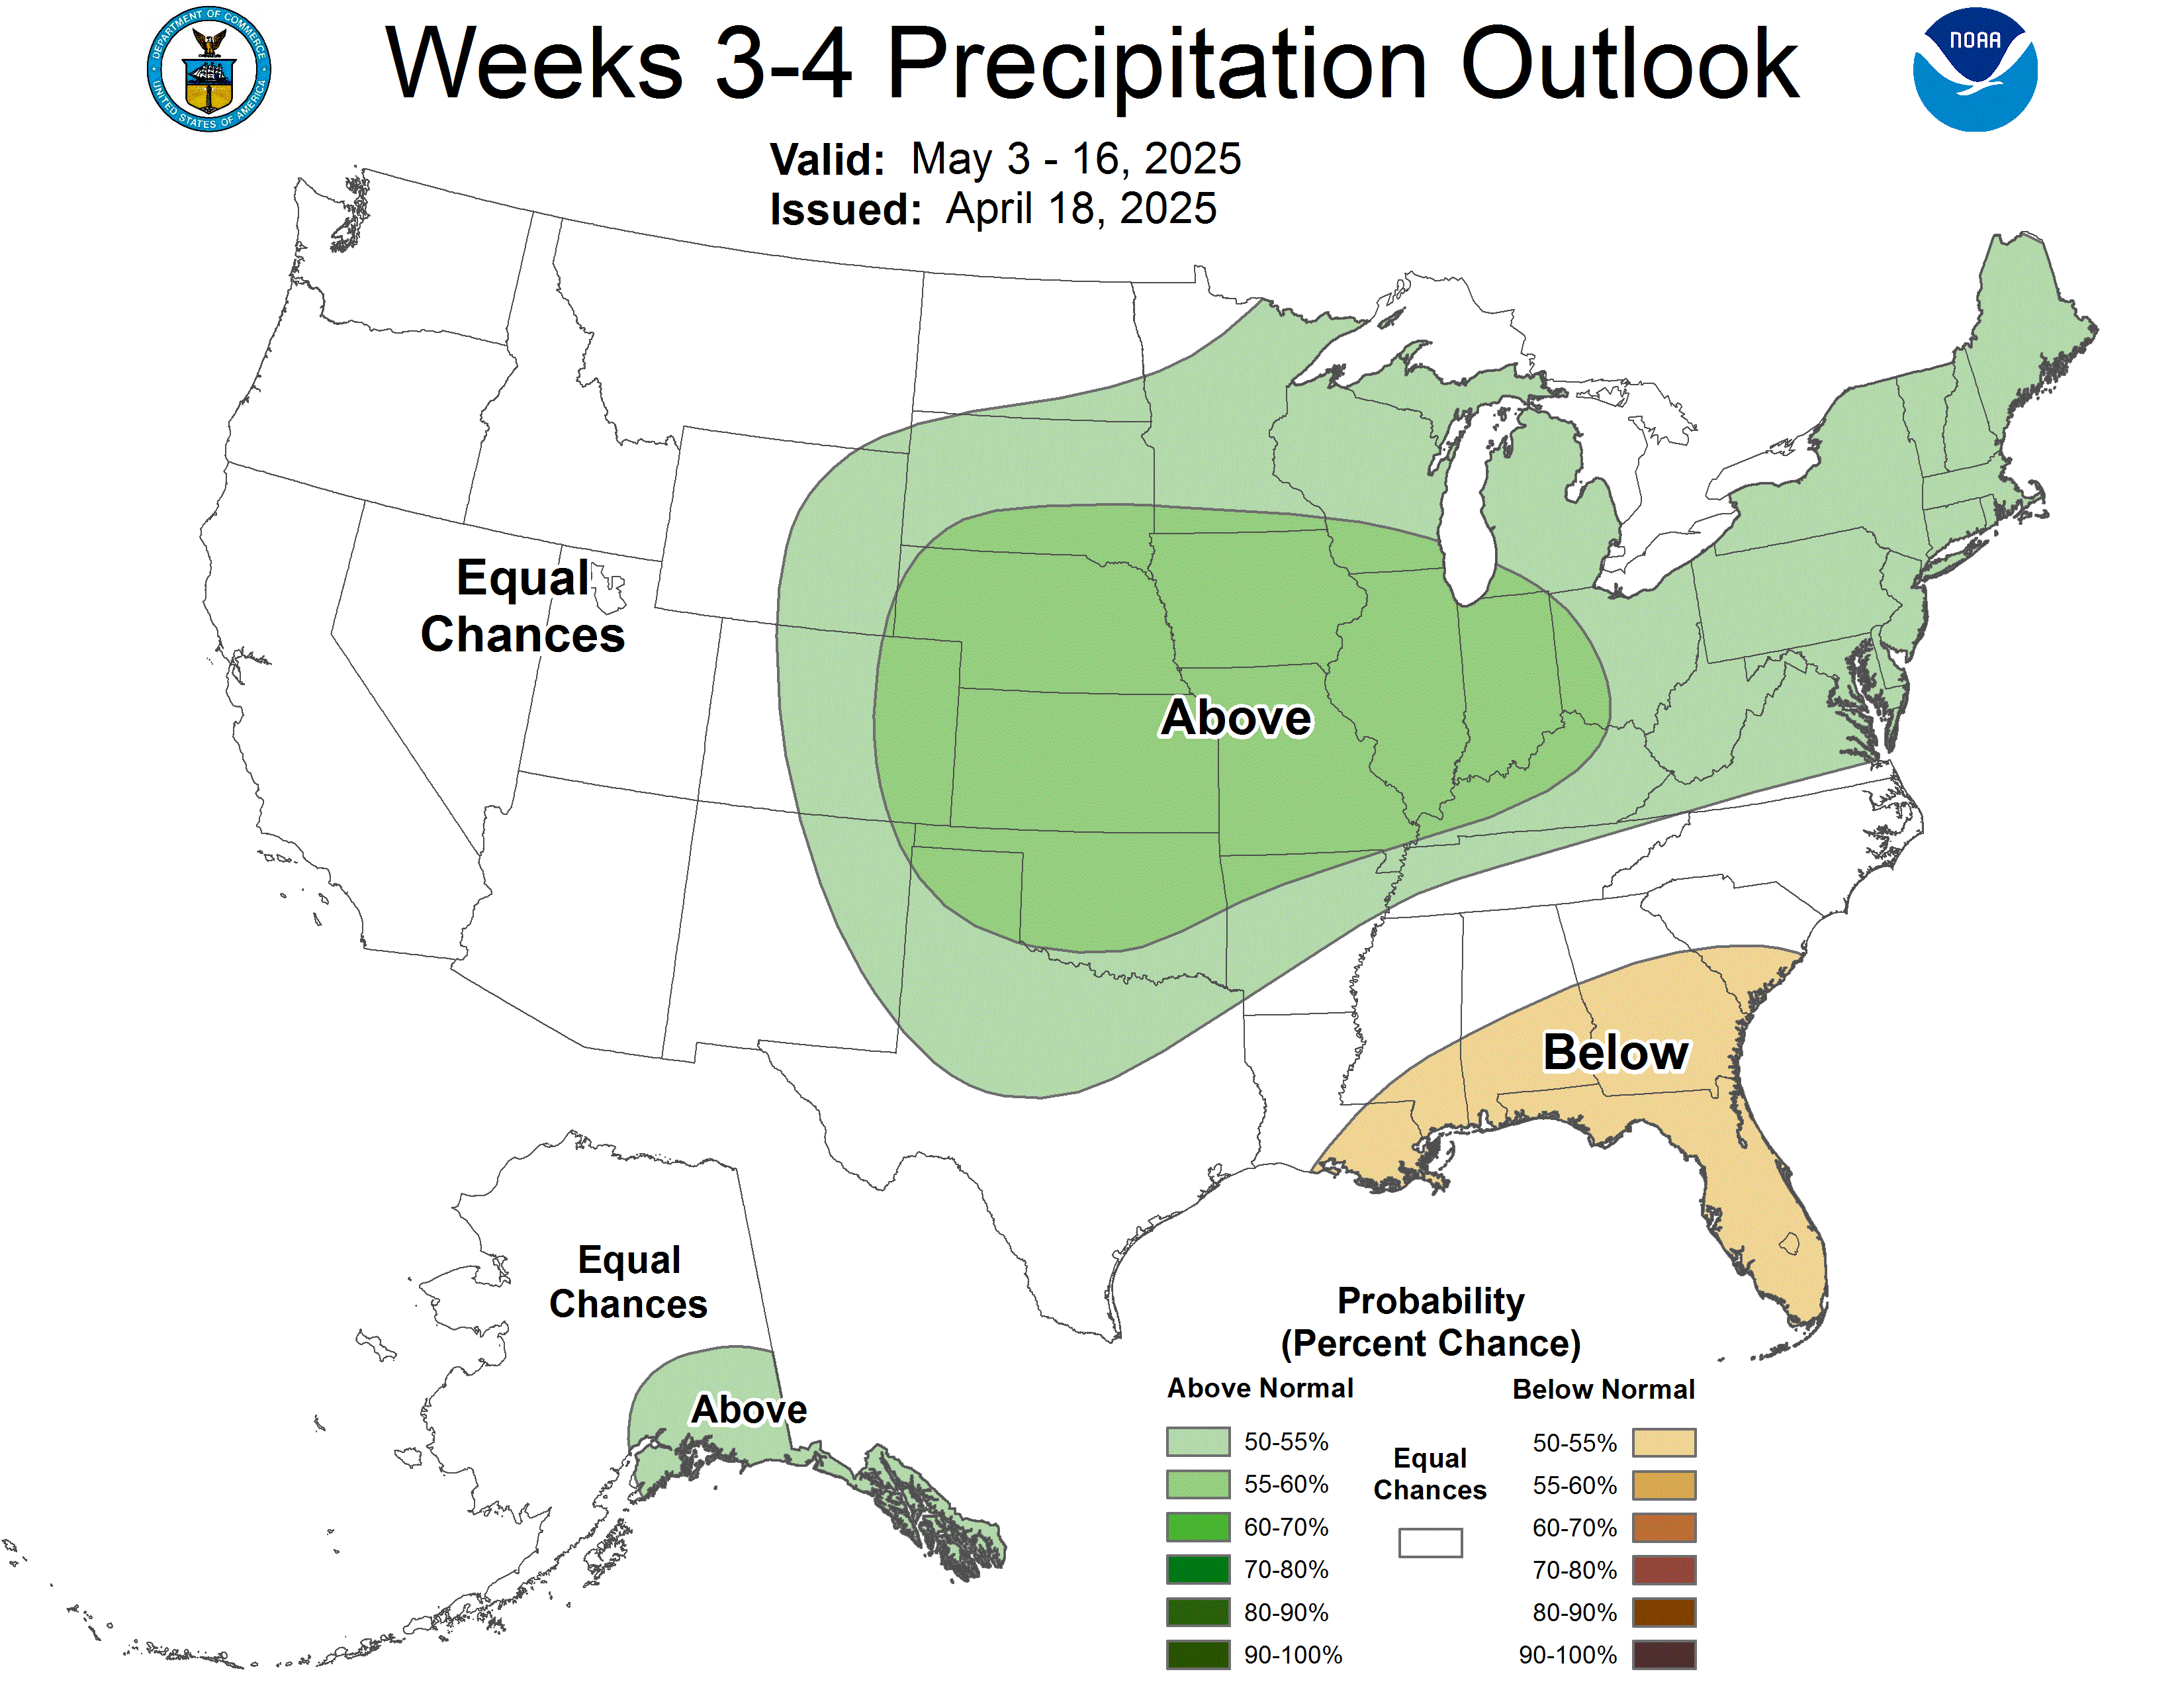
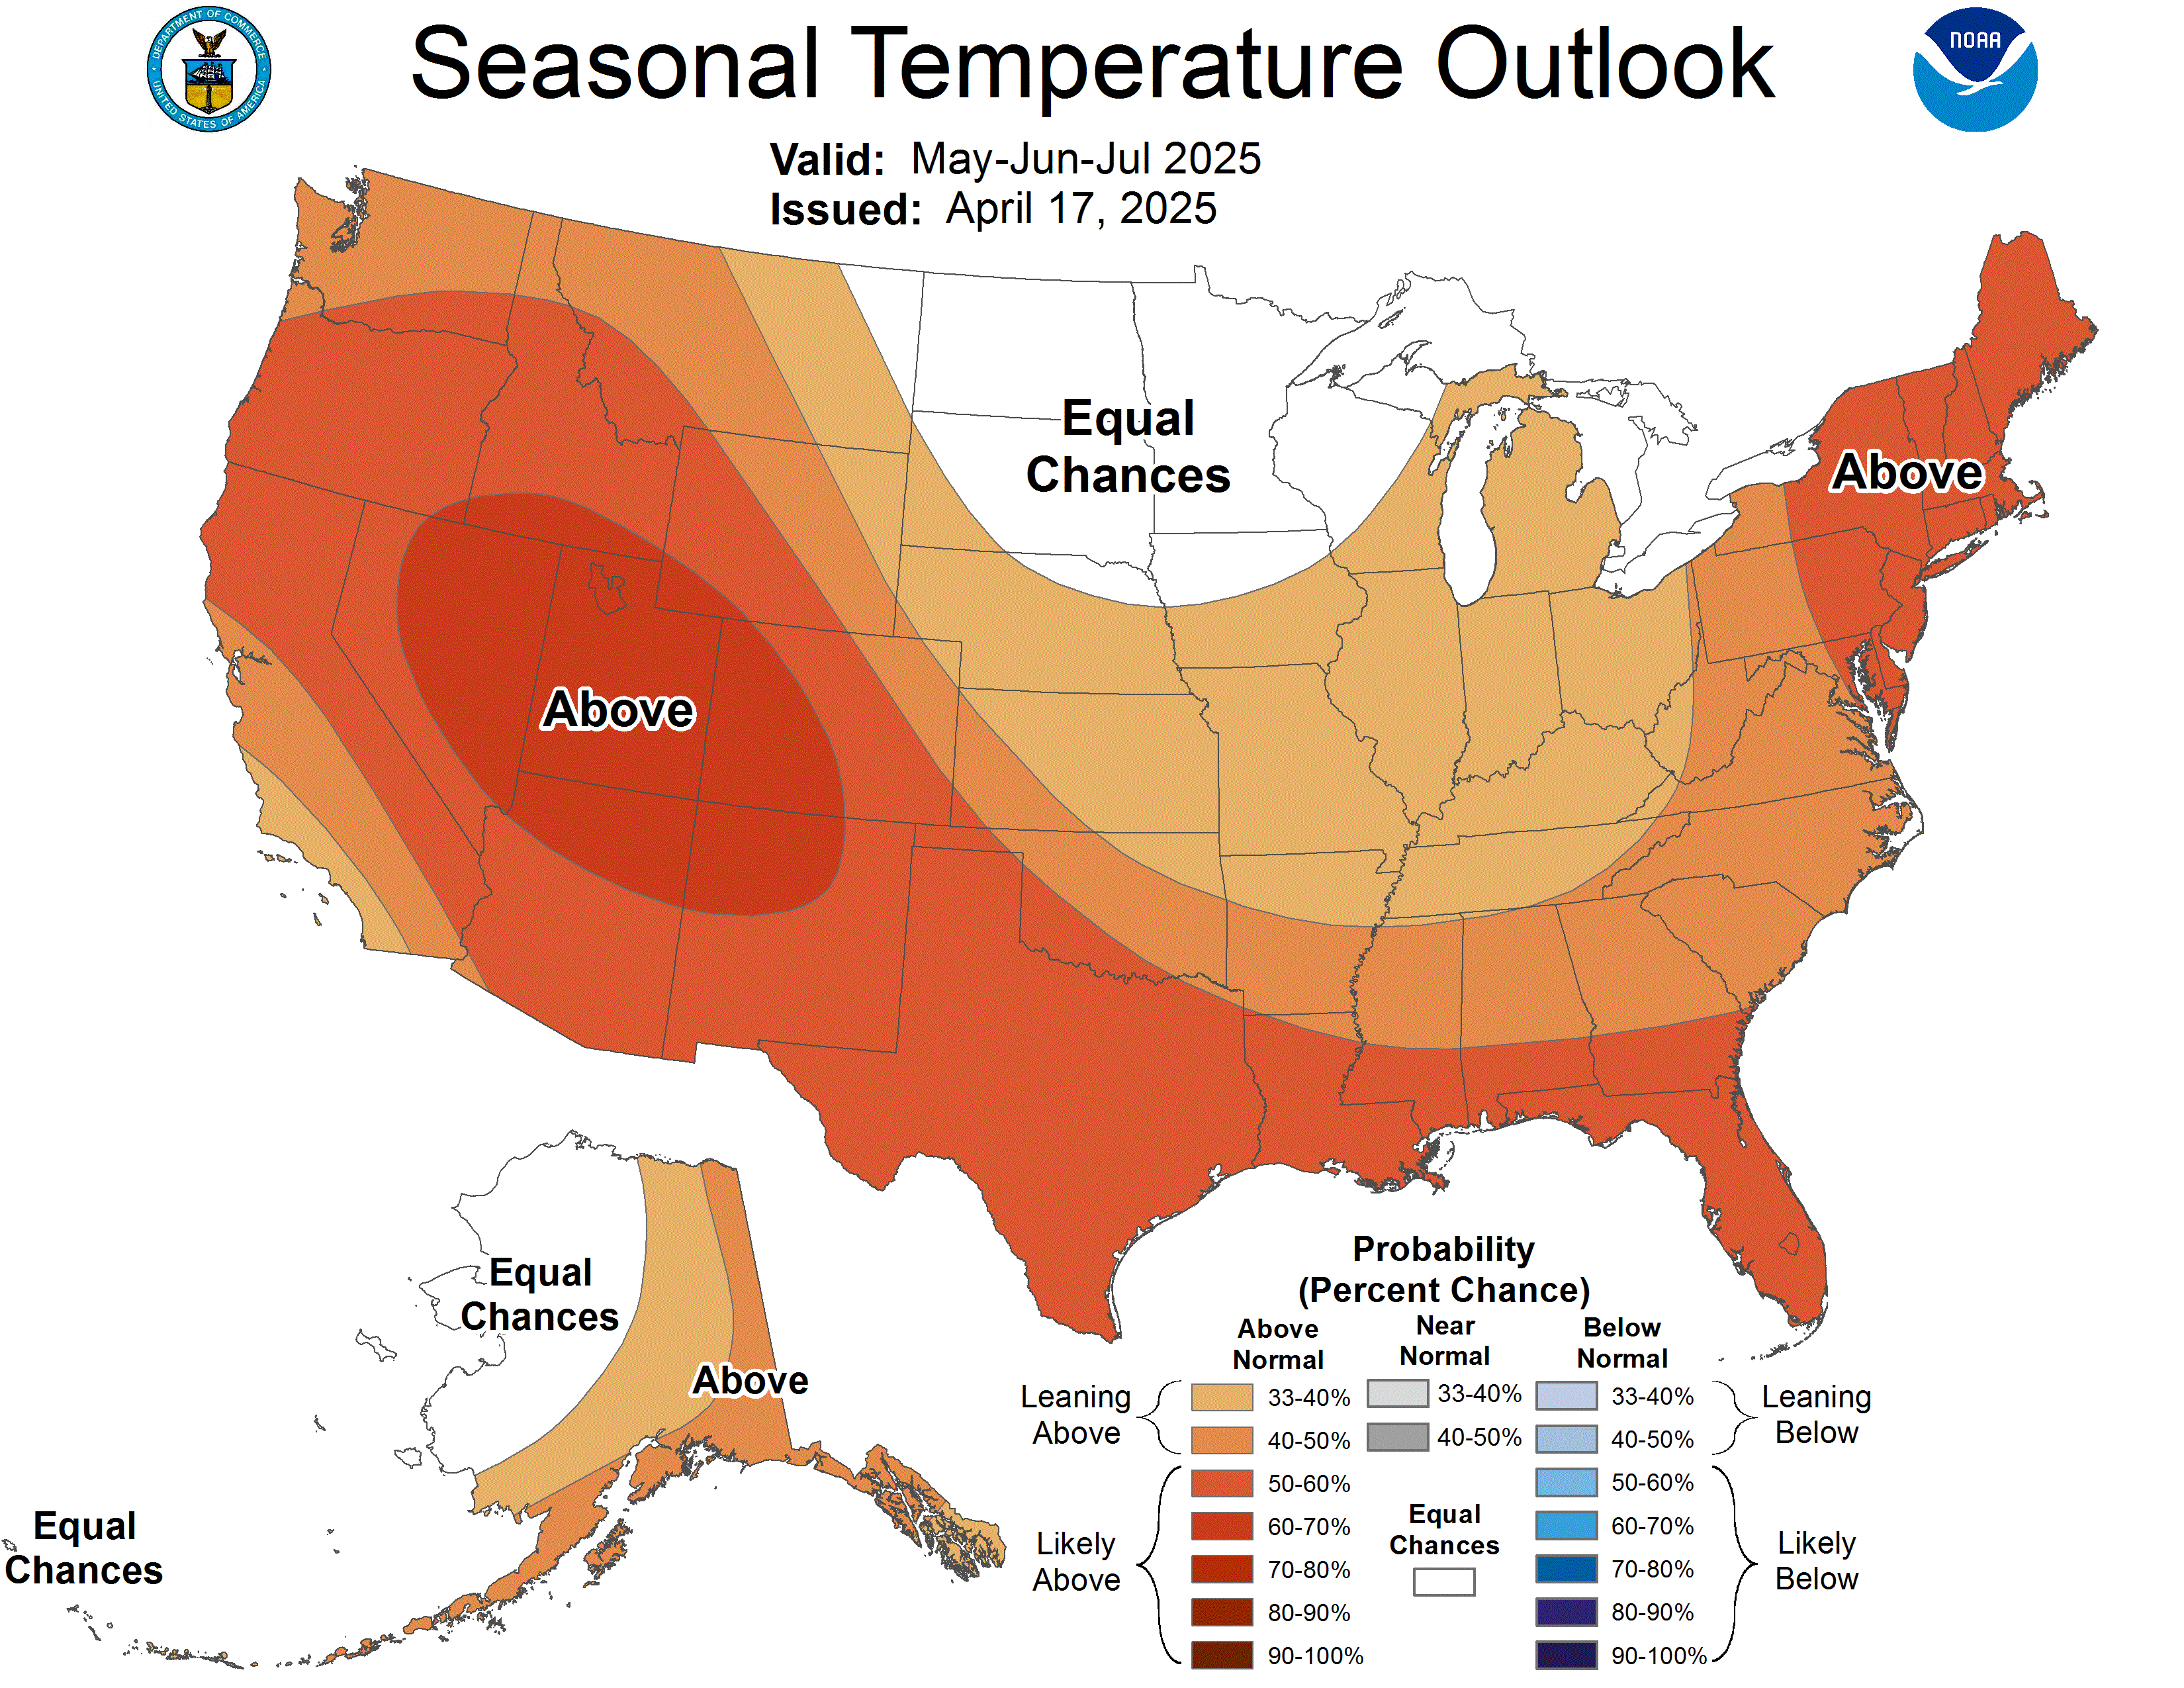
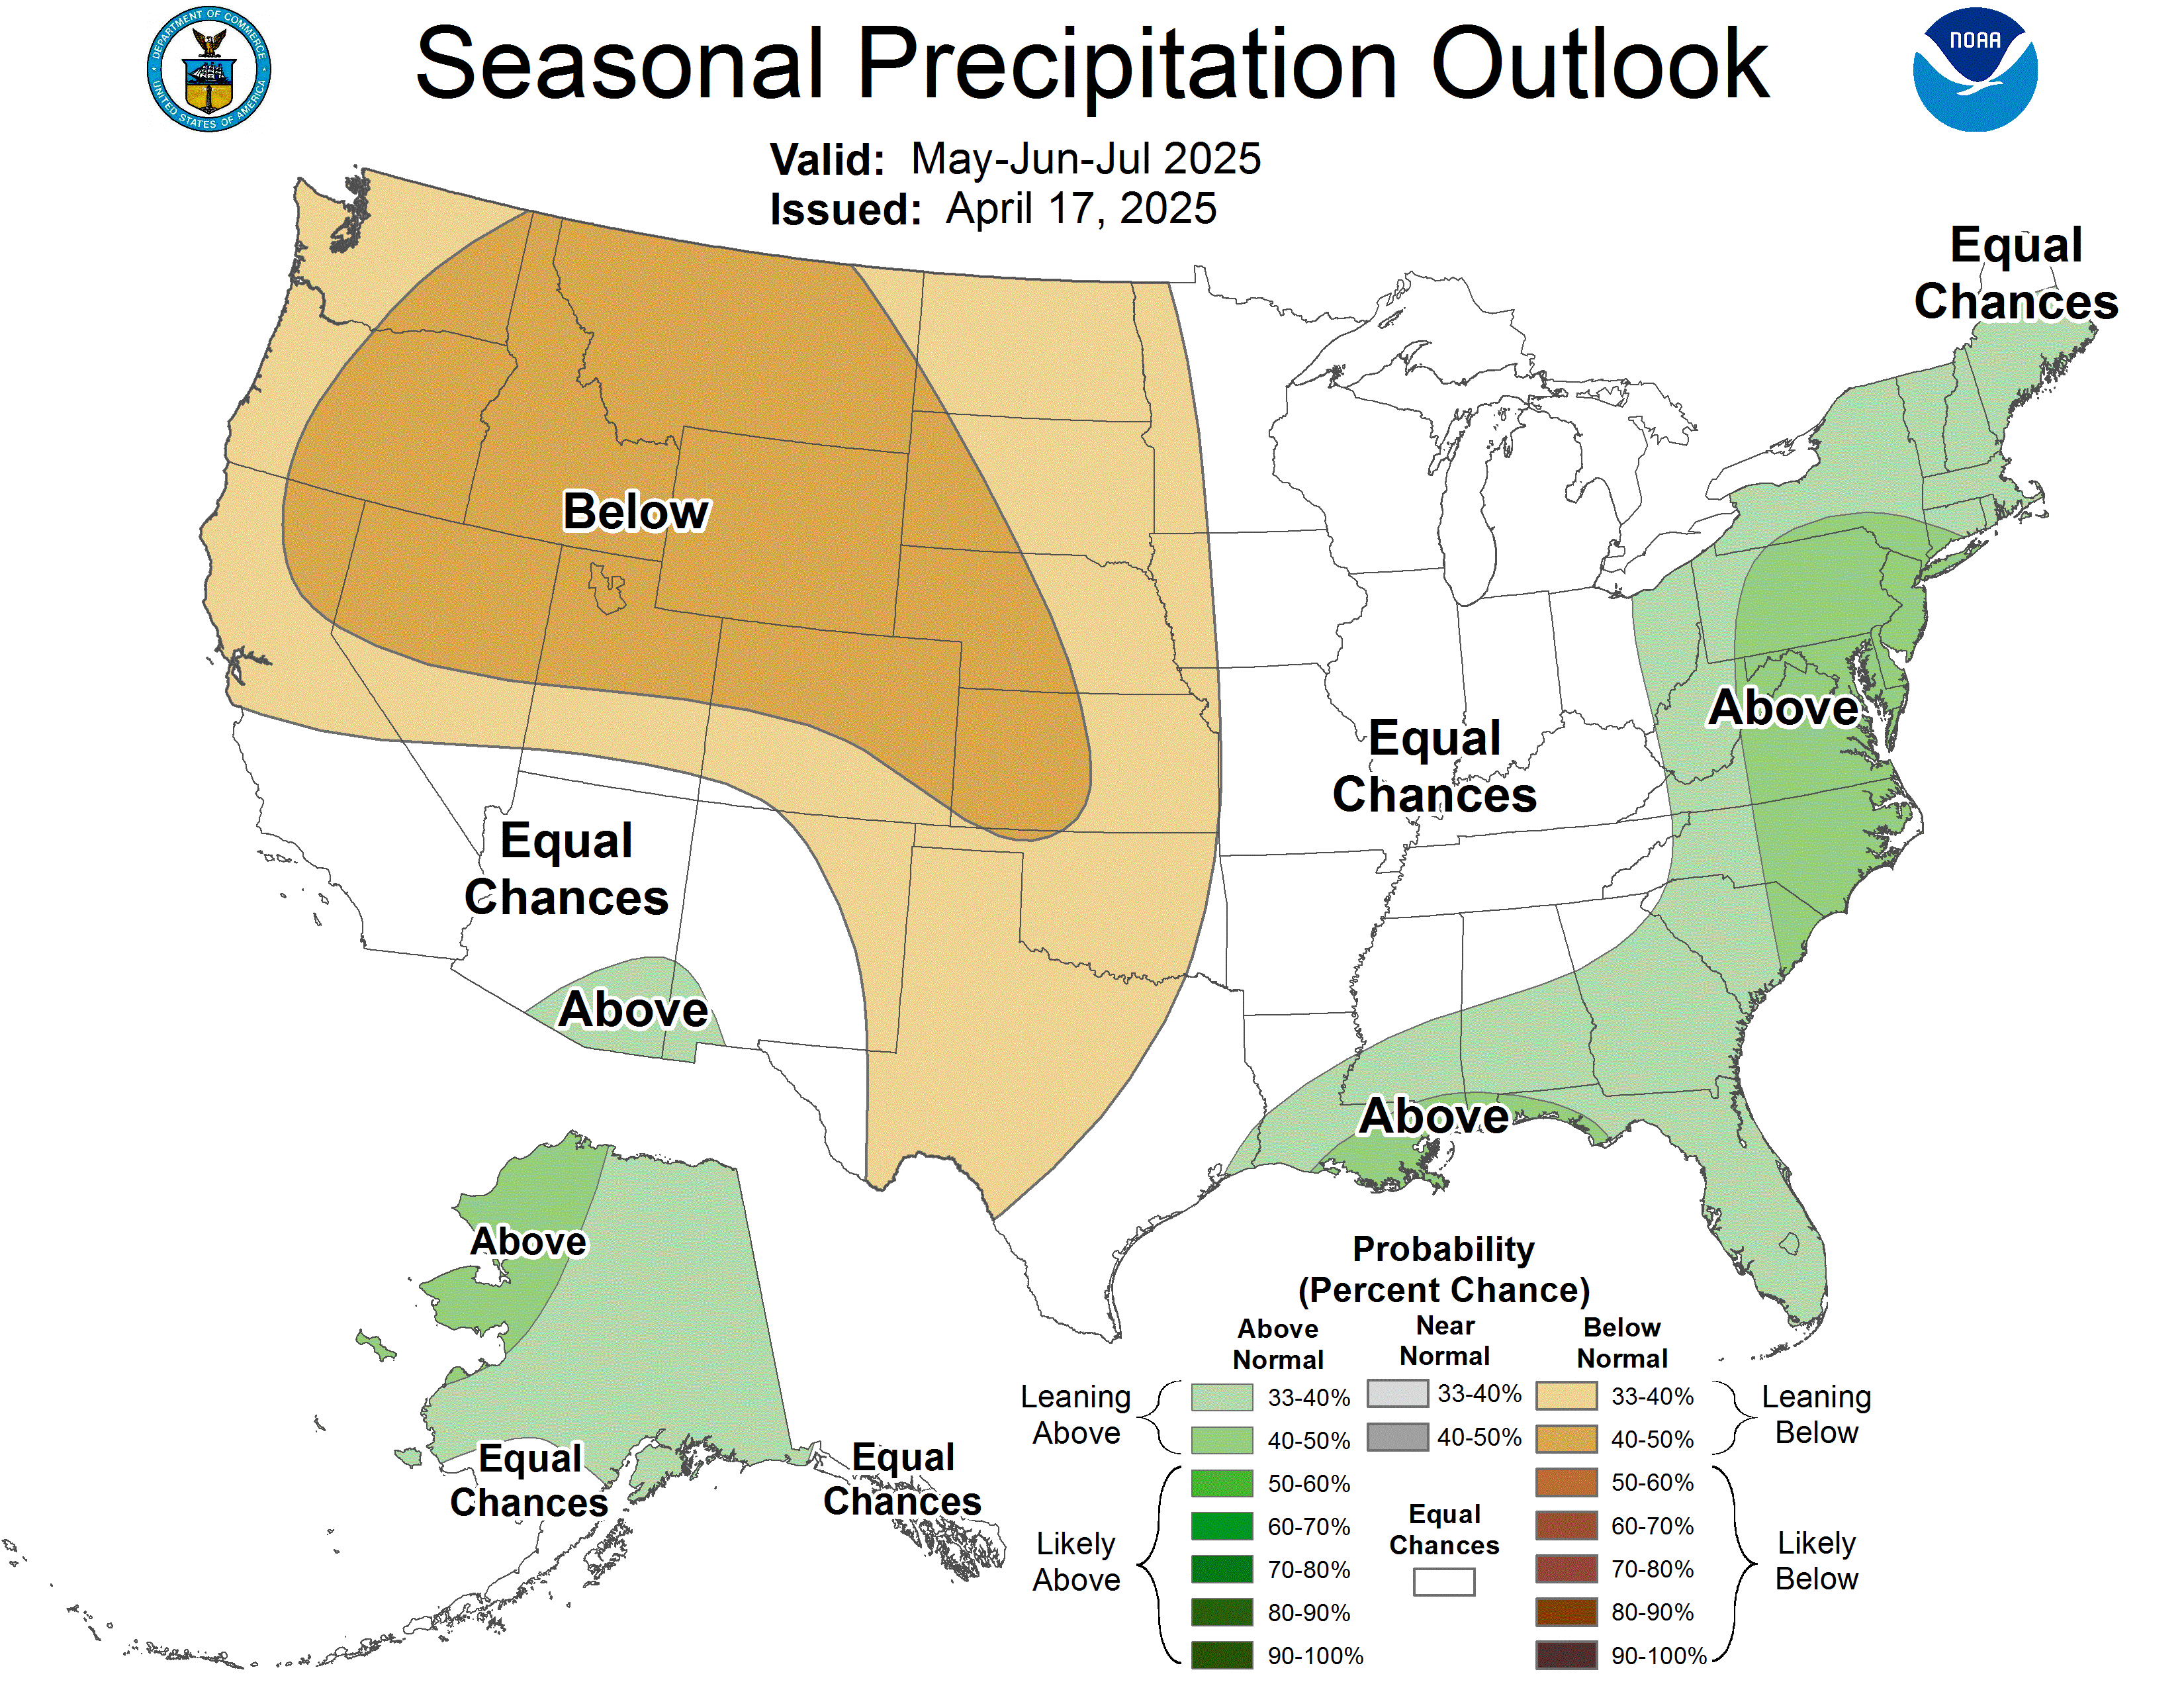
Professional forecast model maps — switch models, parameters, and time steps
Live weather maps for Truckee, Lake Tahoe, and the Sierra Nevada including real-time Doppler radar, precipitation radar loop, wind speed and direction maps, temperature maps, cloud cover, thunderstorm tracking, snow depth, and GOES-18 satellite imagery. Our radar covers the Reno CWA (KRGX) with playable loops showing the last 3-6 hours of precipitation movement across I-80, Donner Pass, and the greater Tahoe Basin.
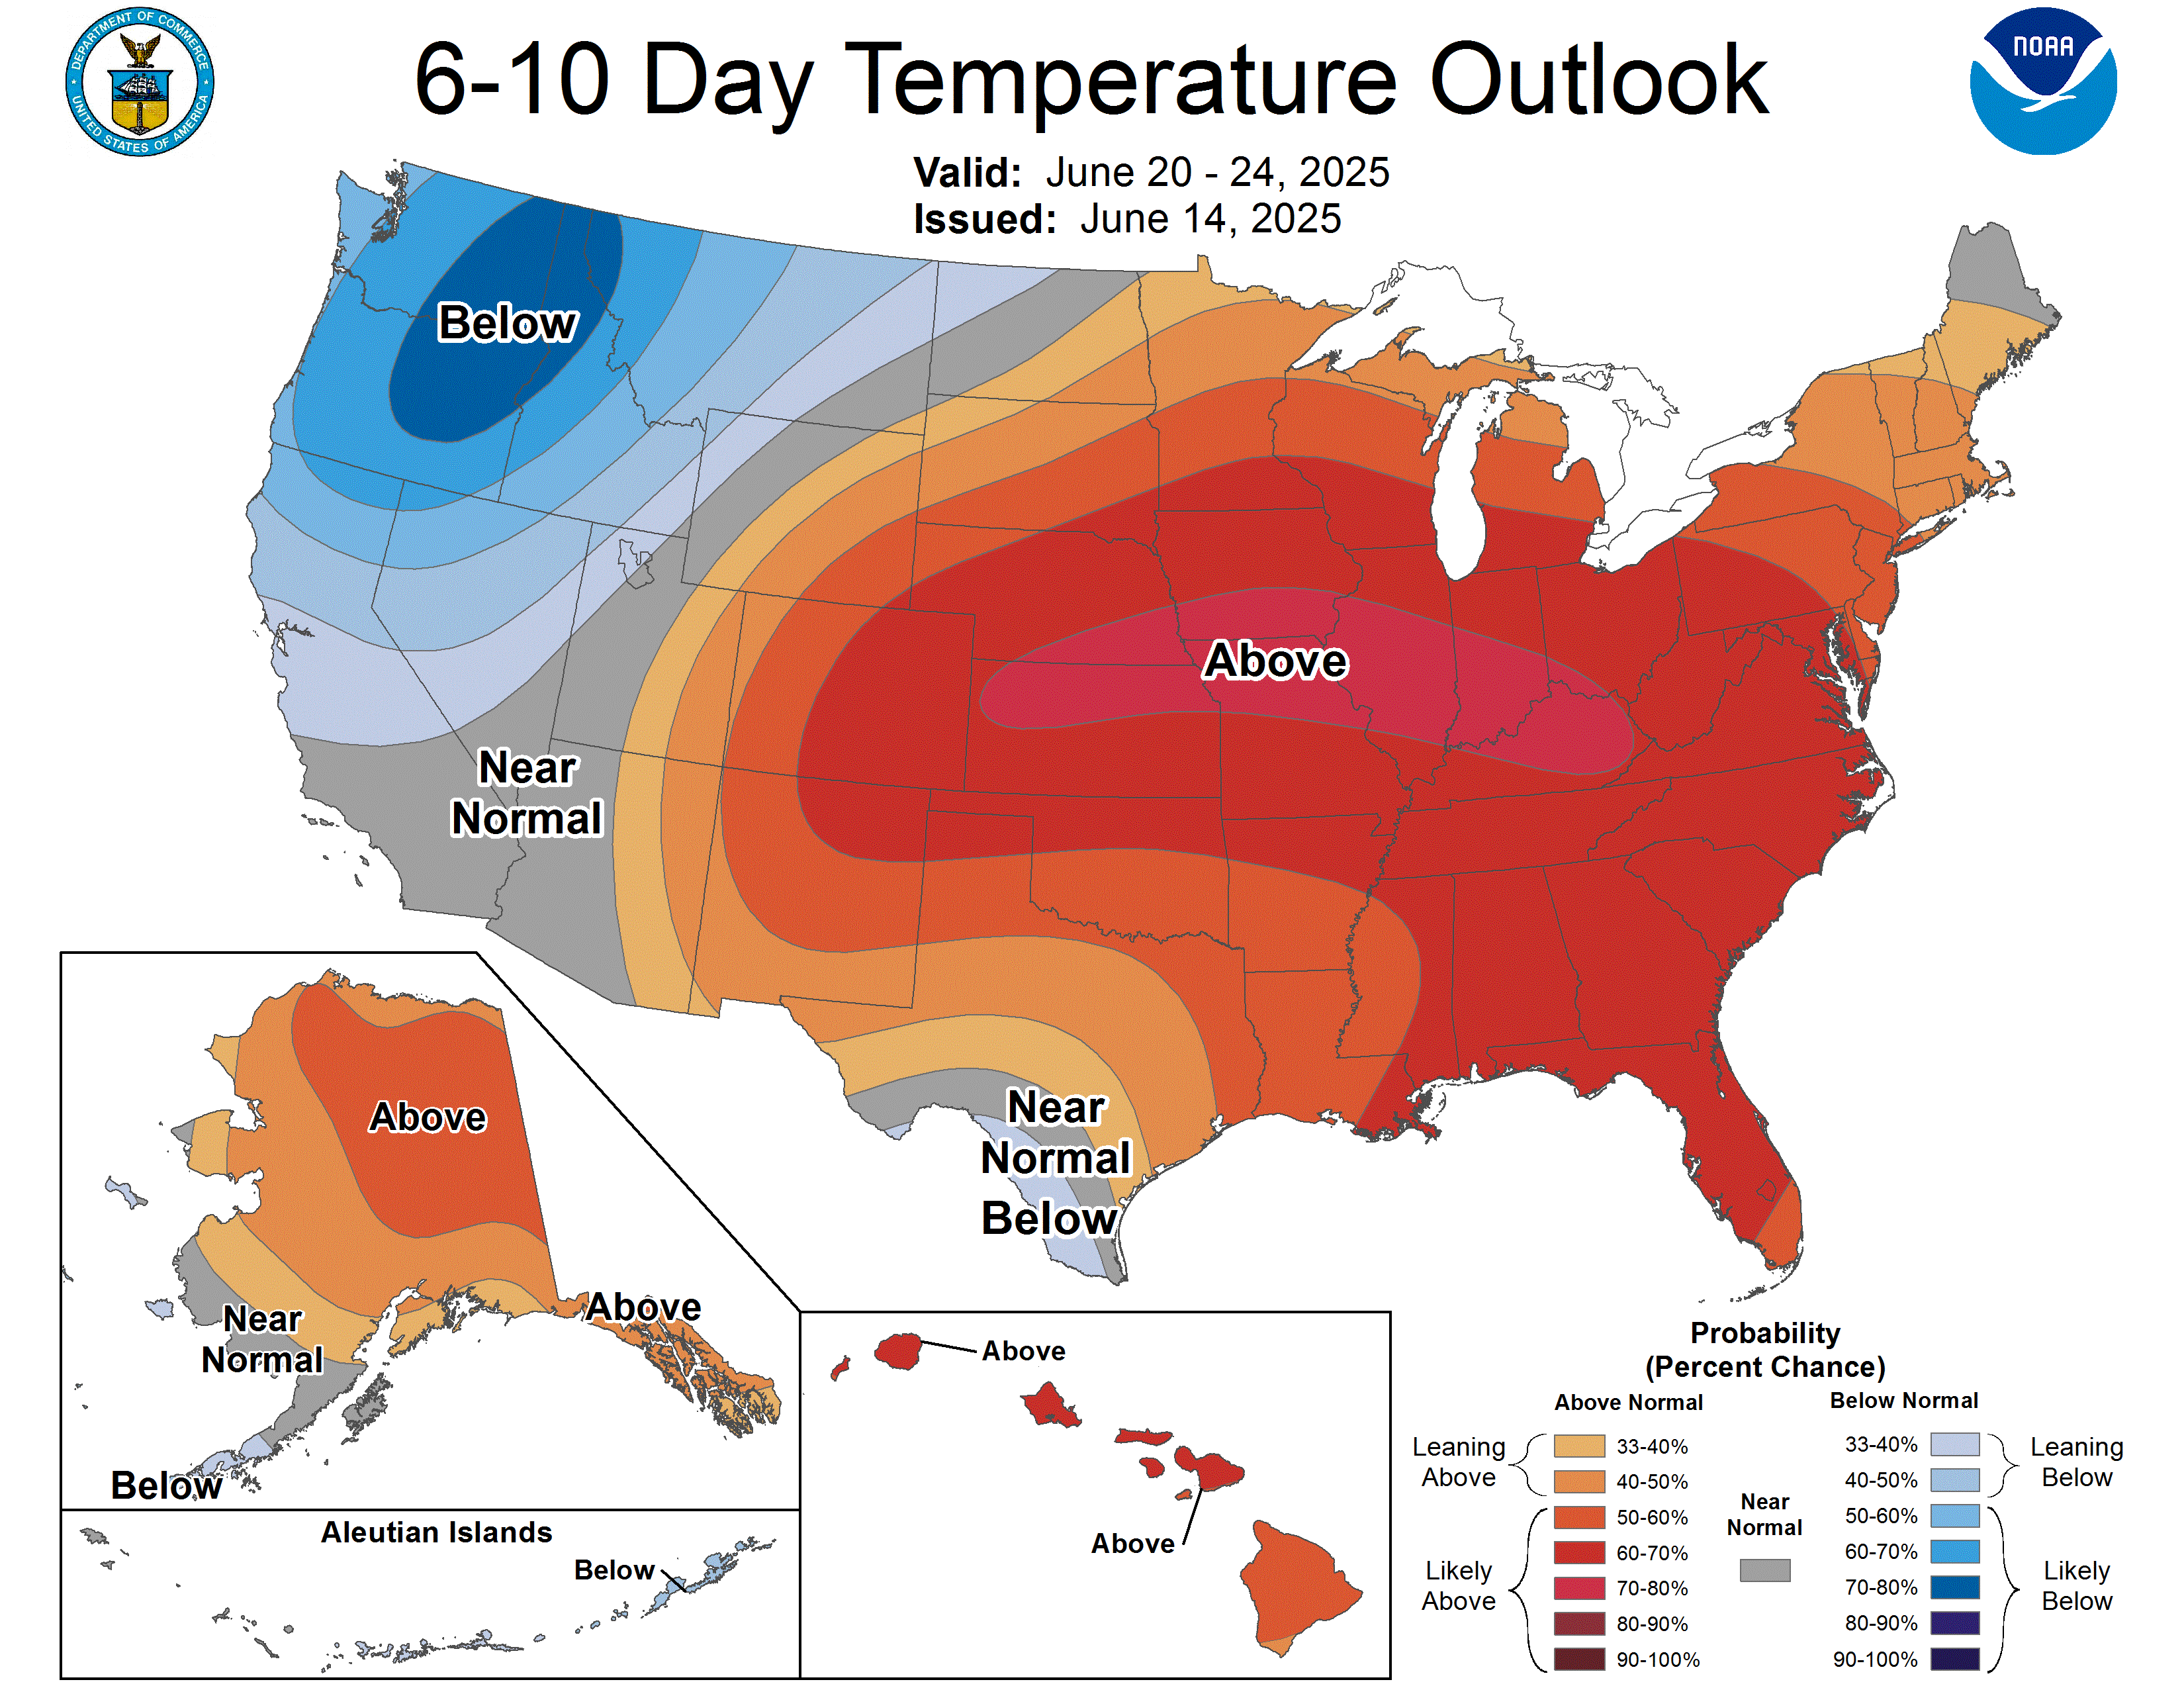
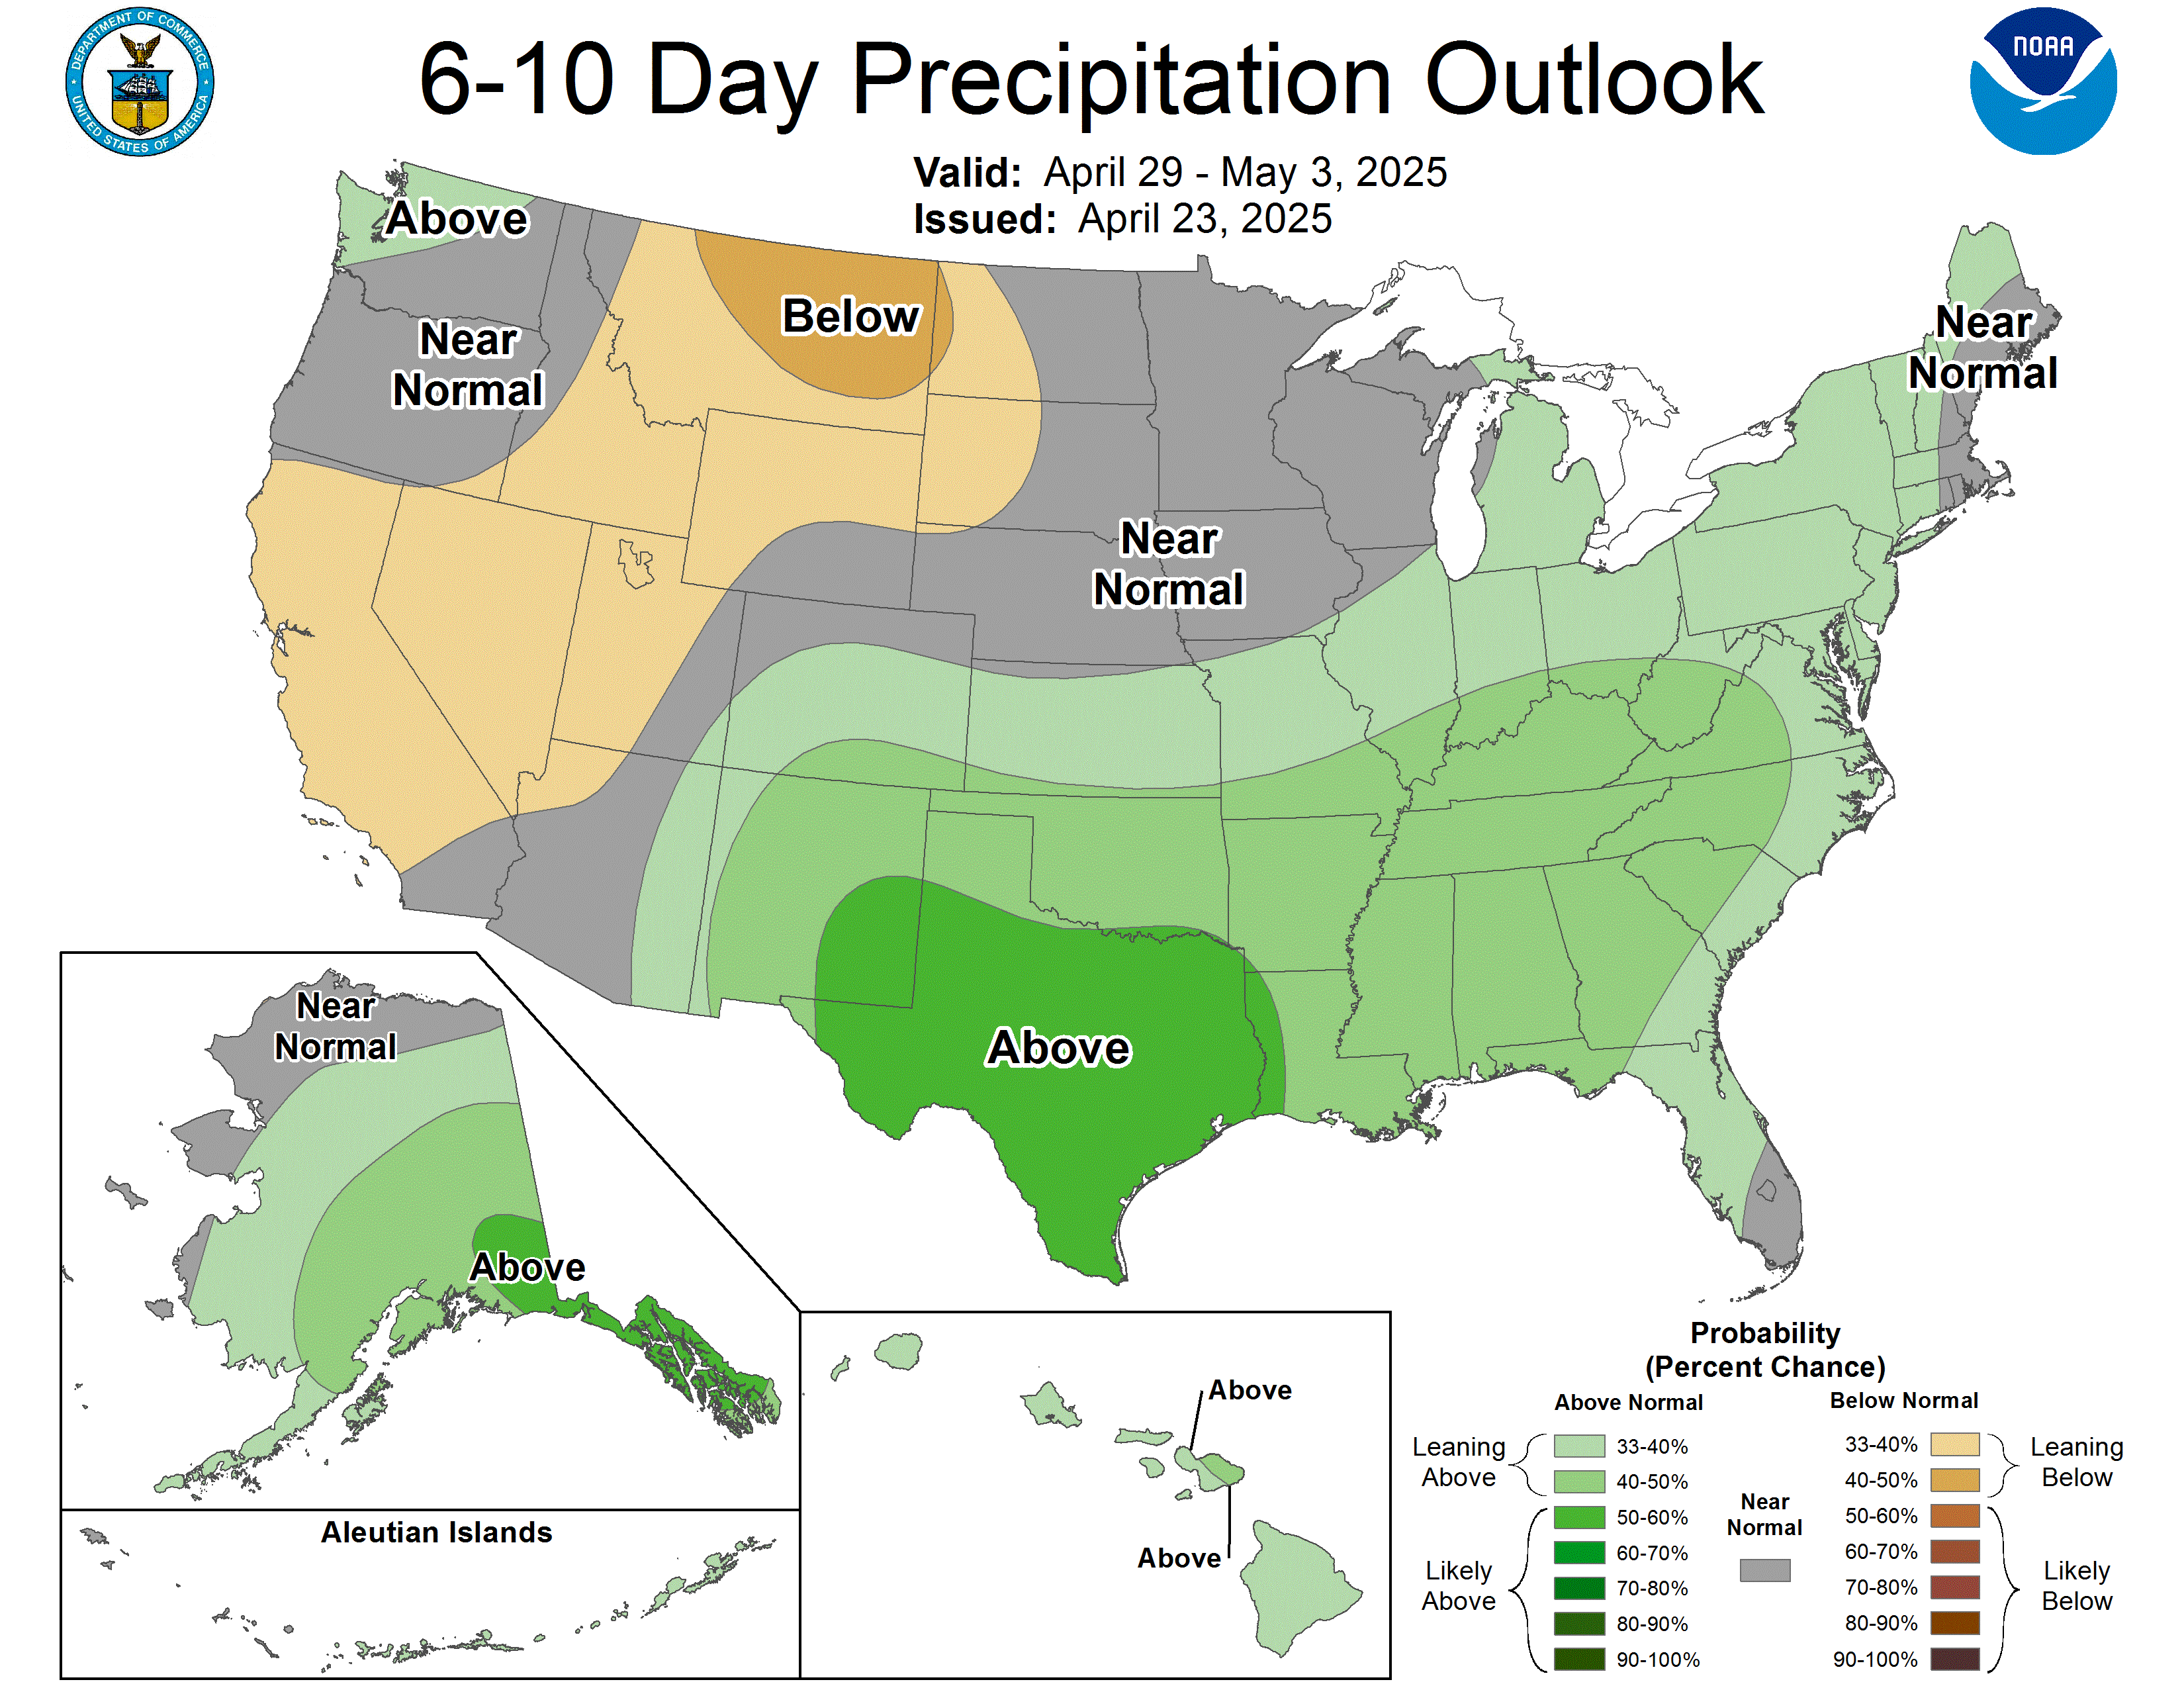
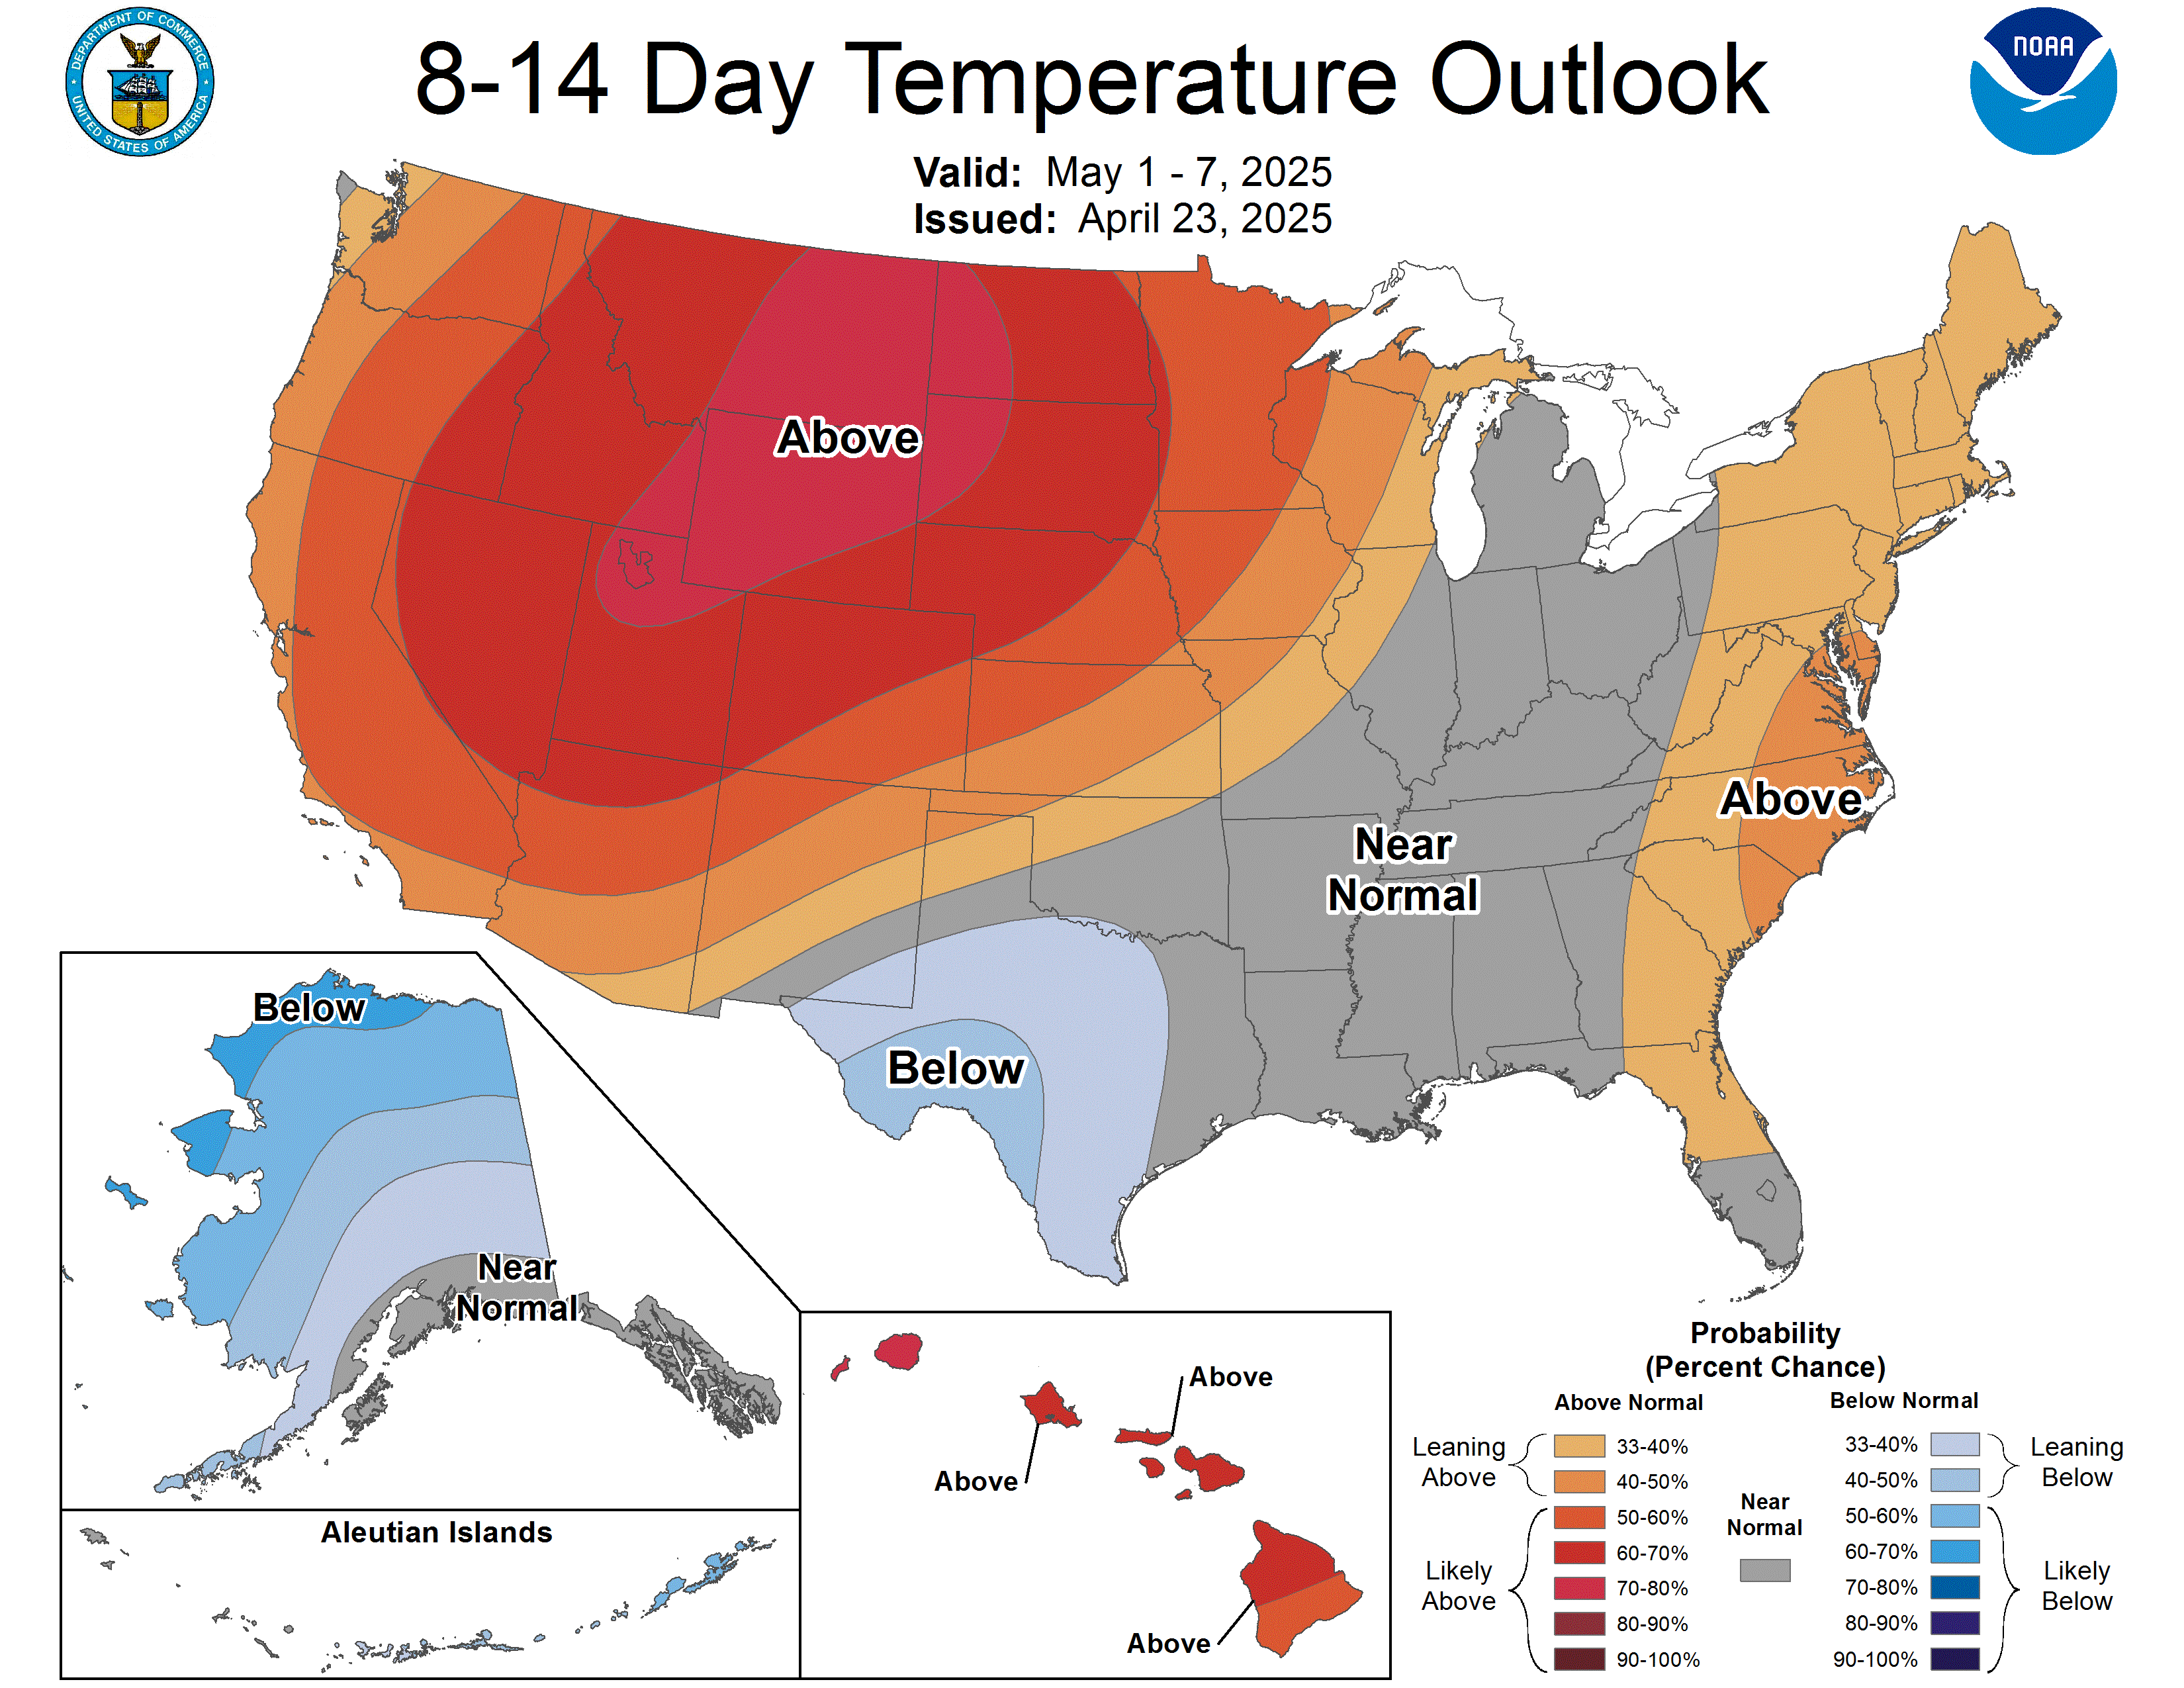
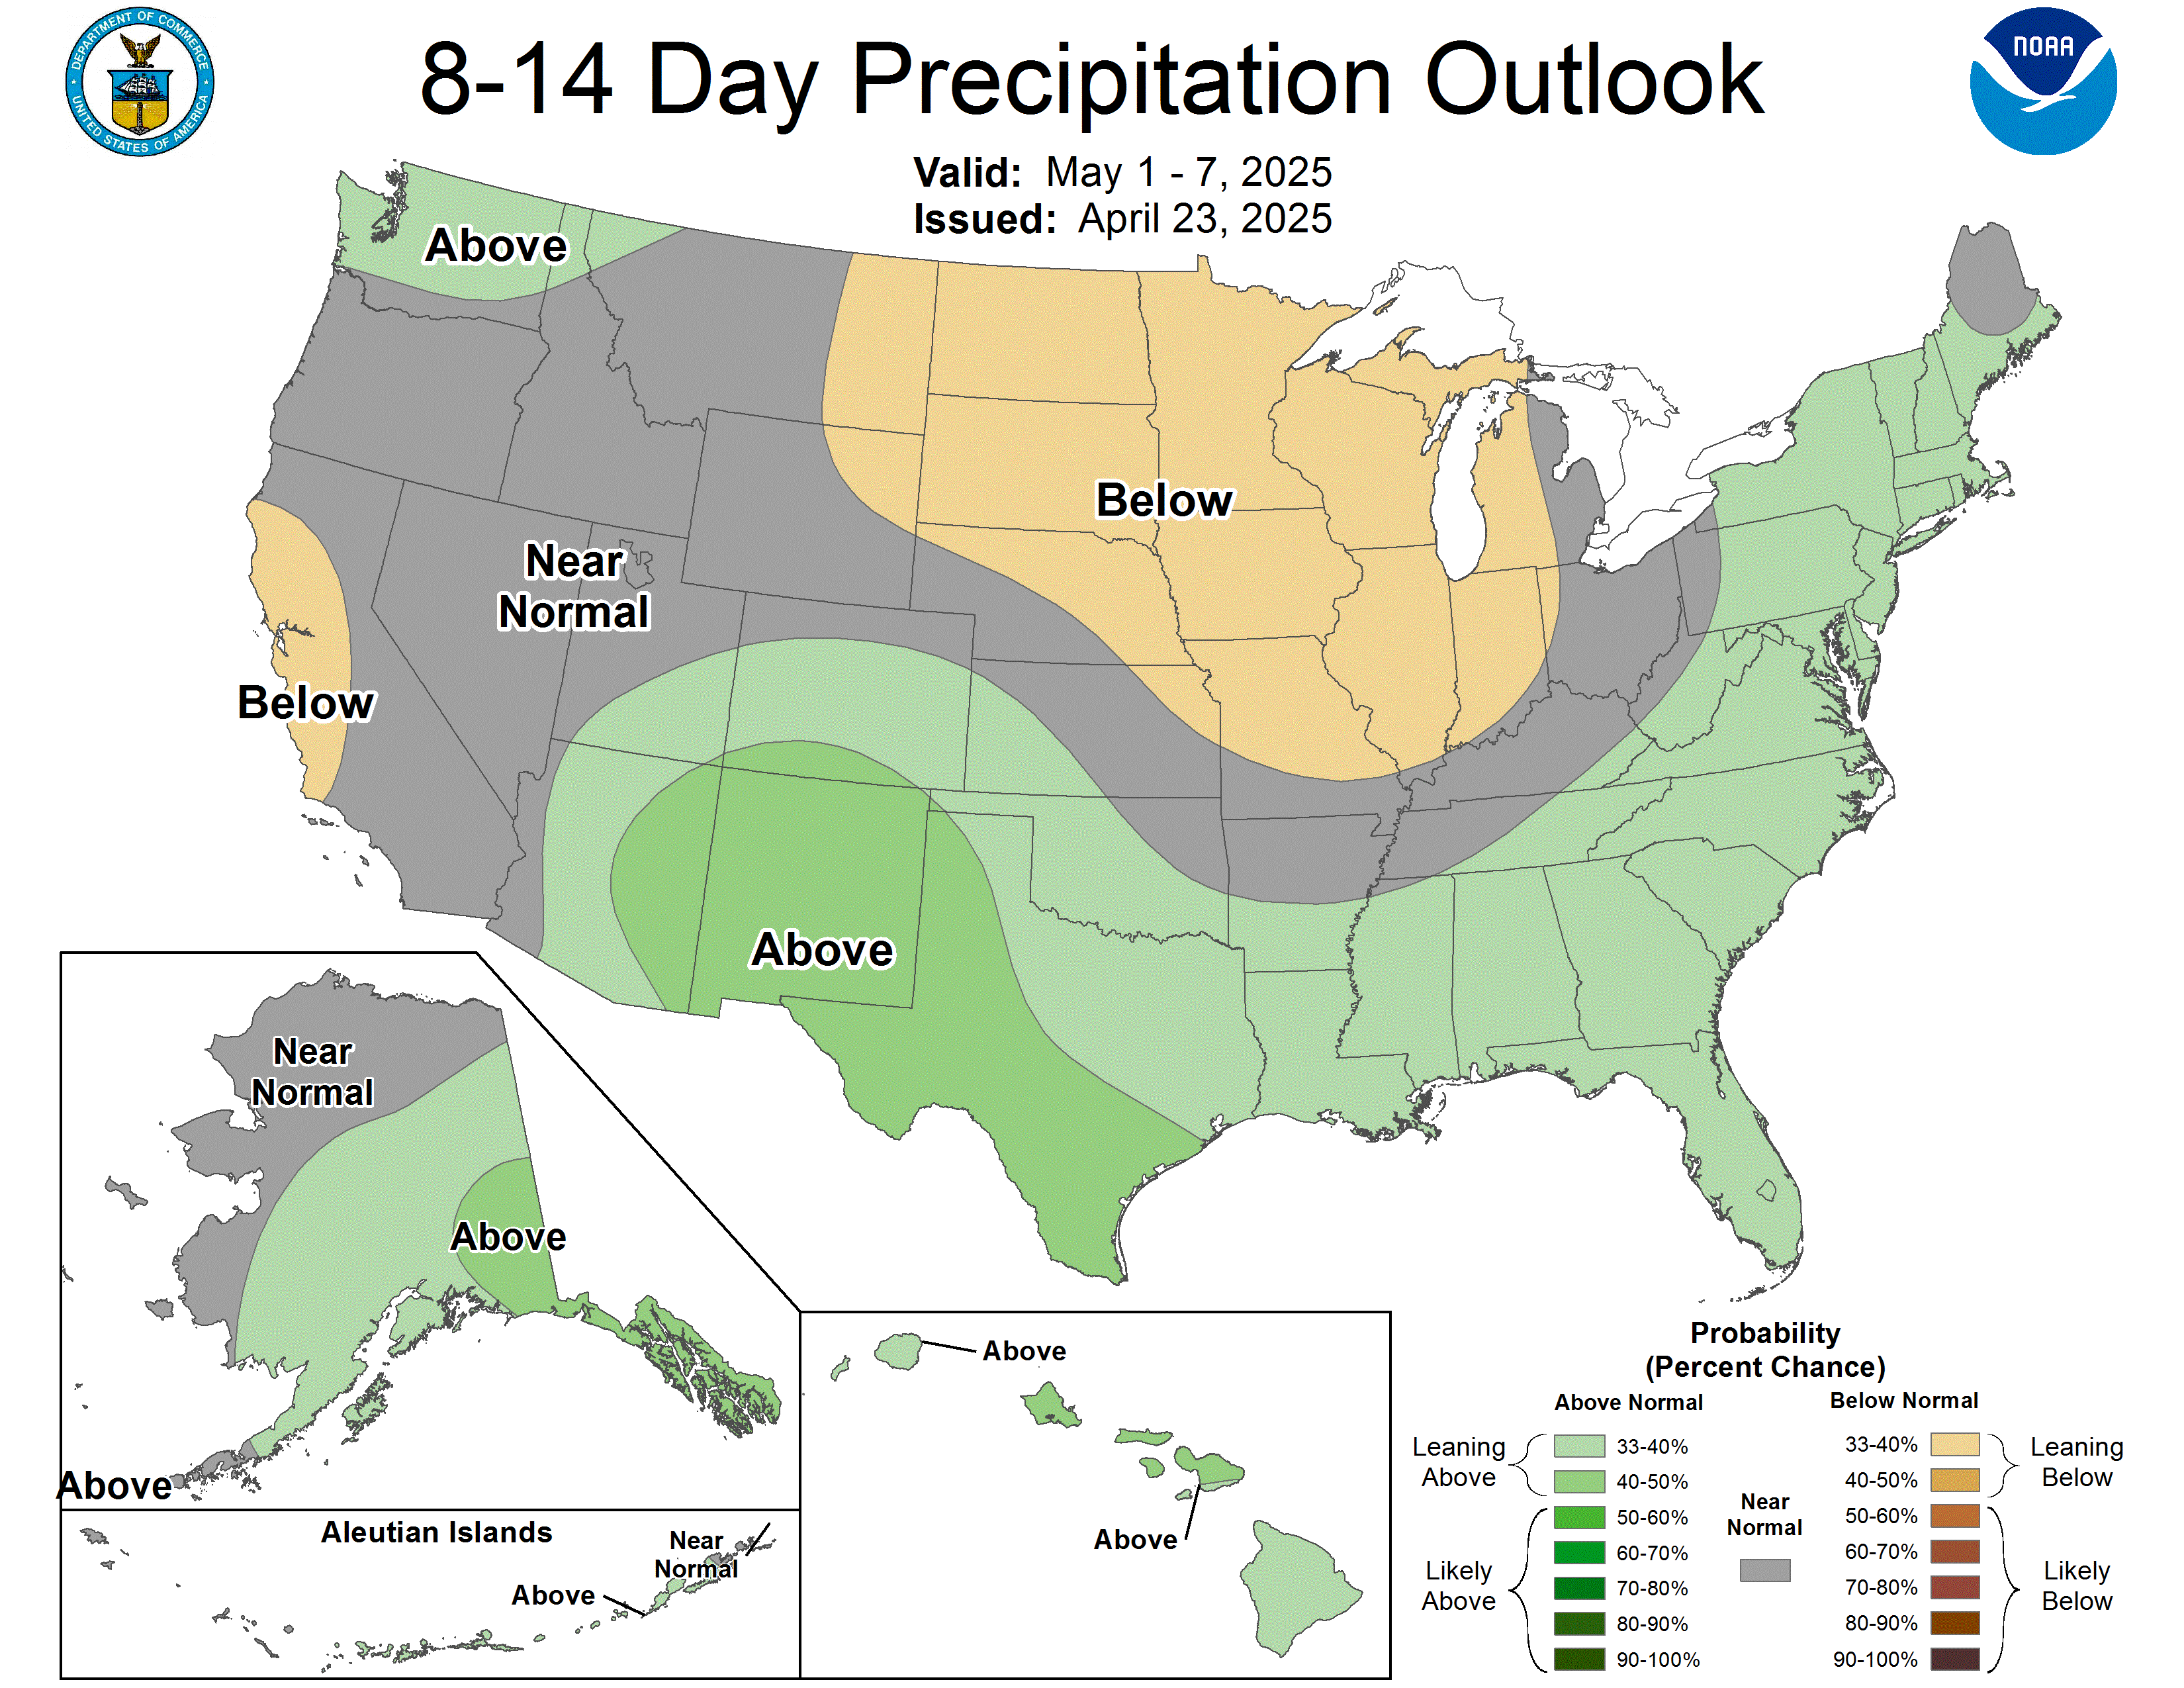
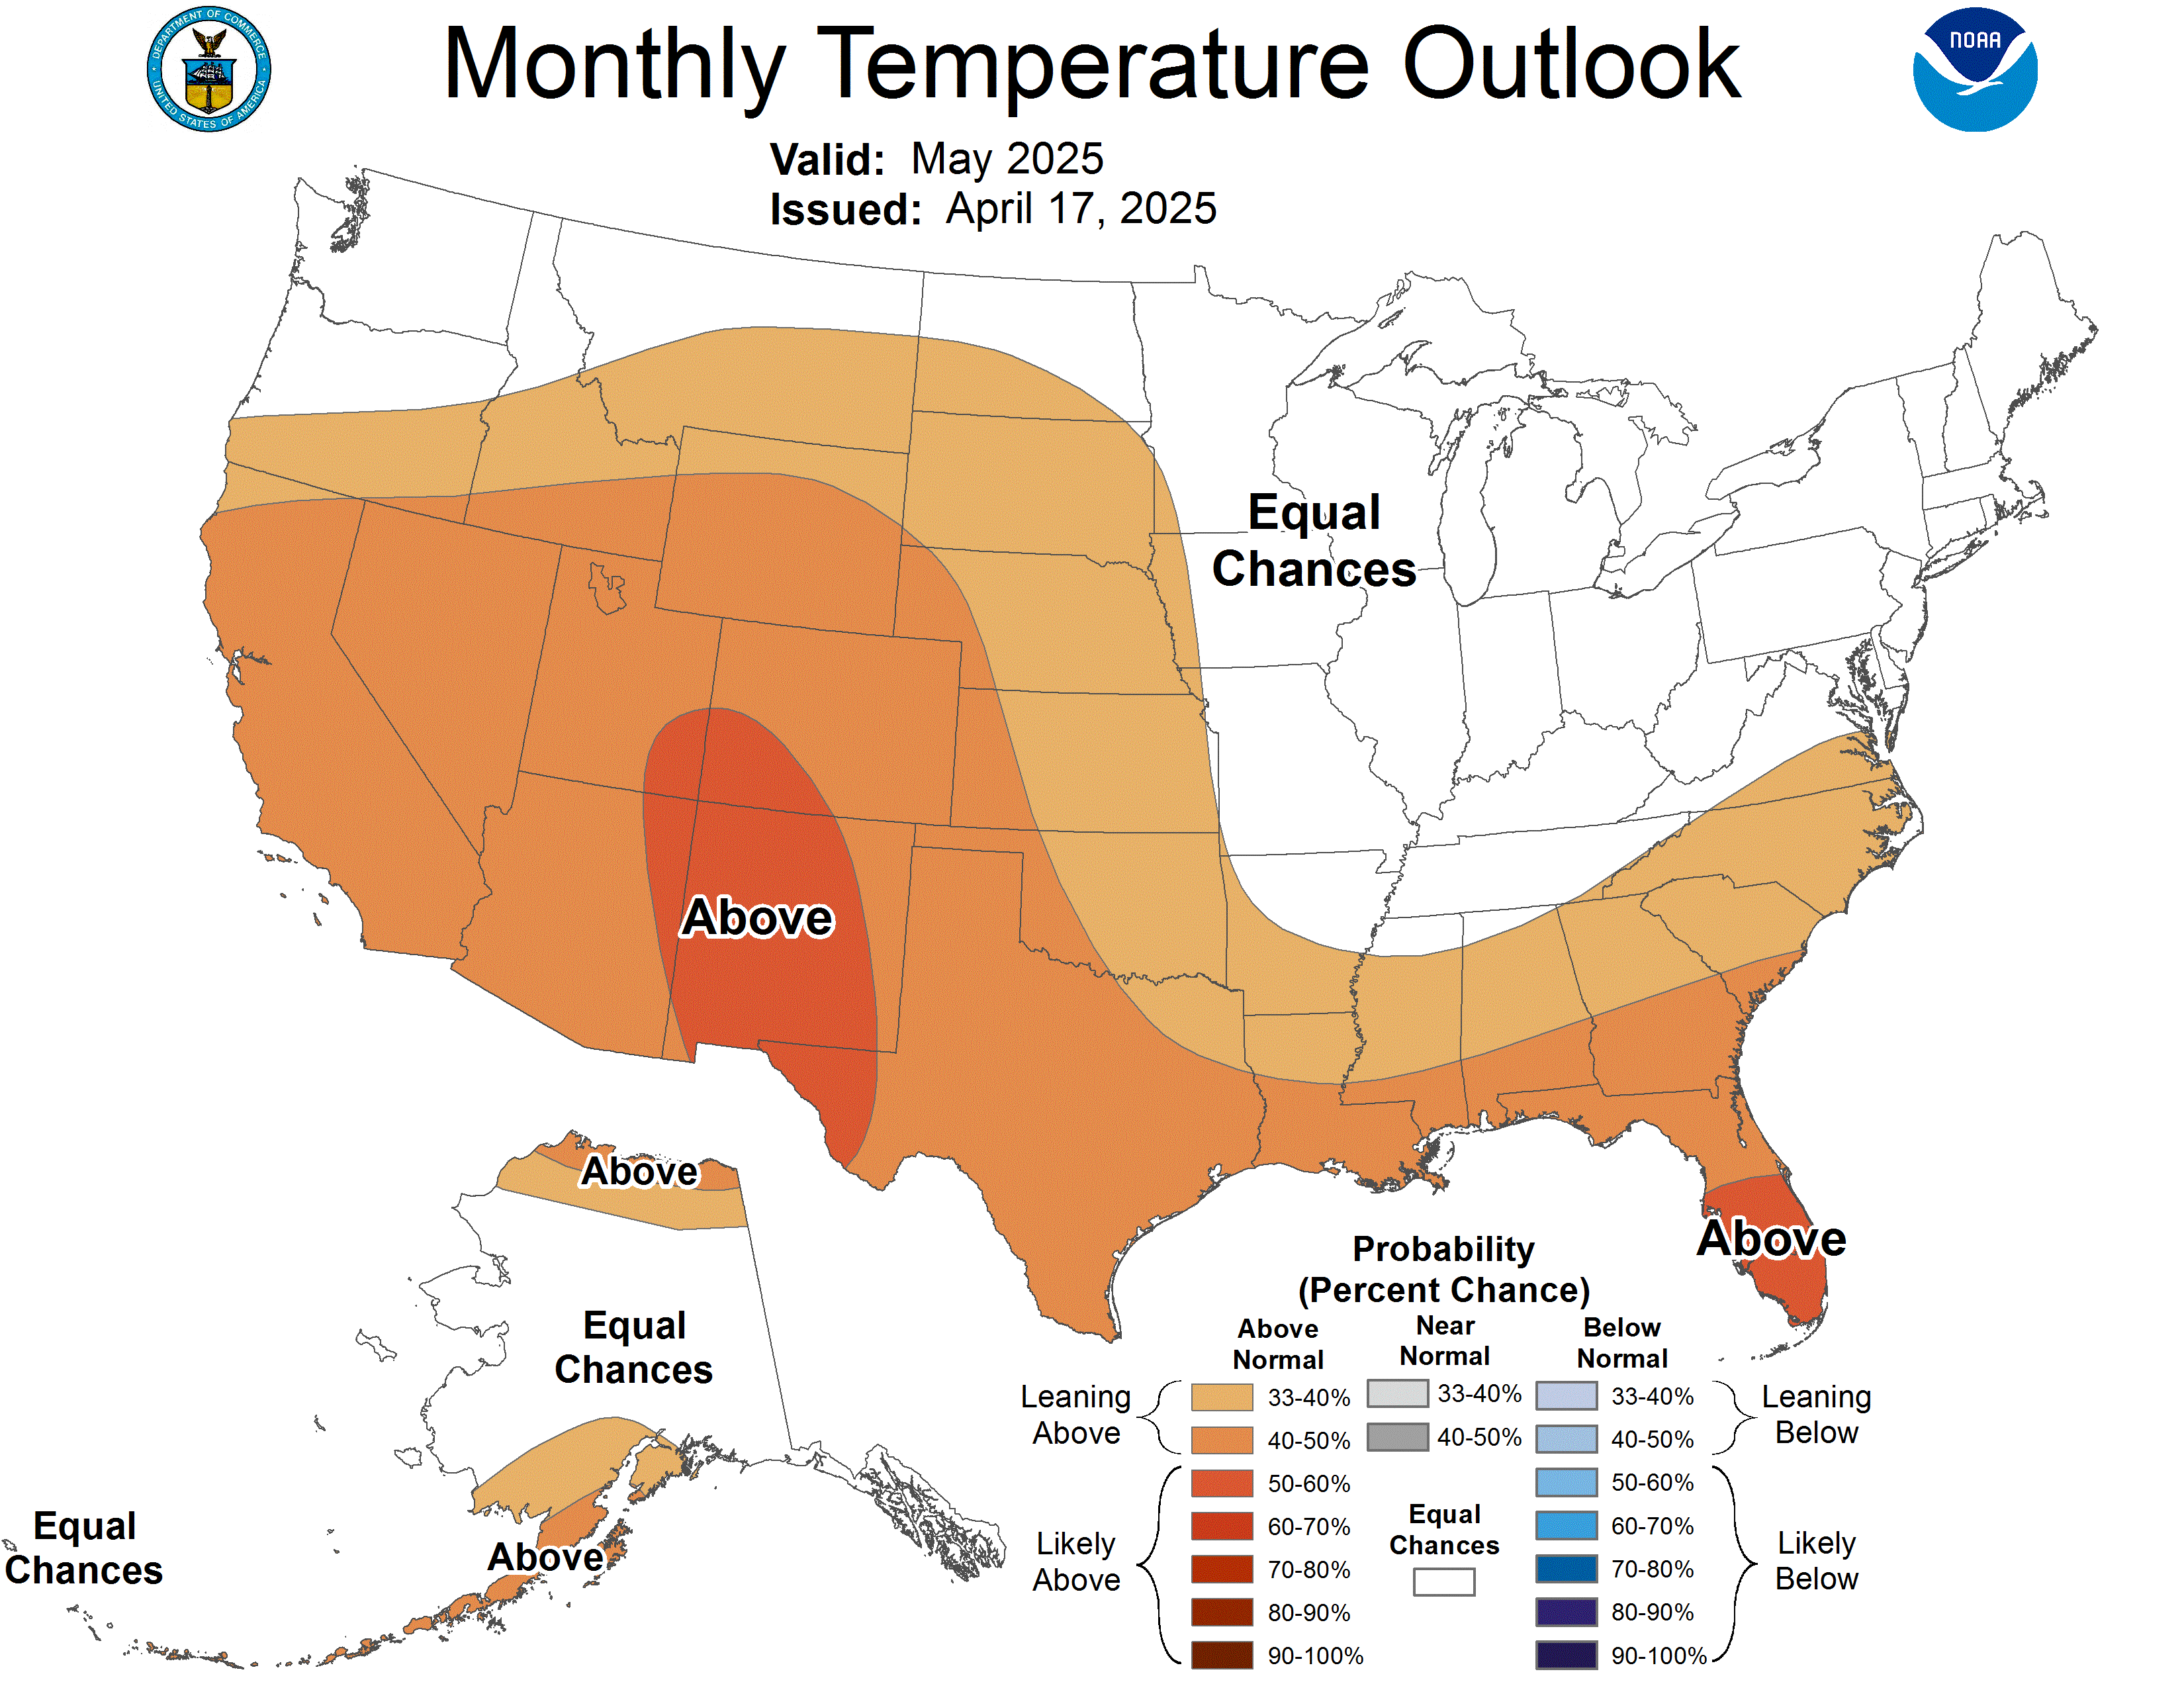
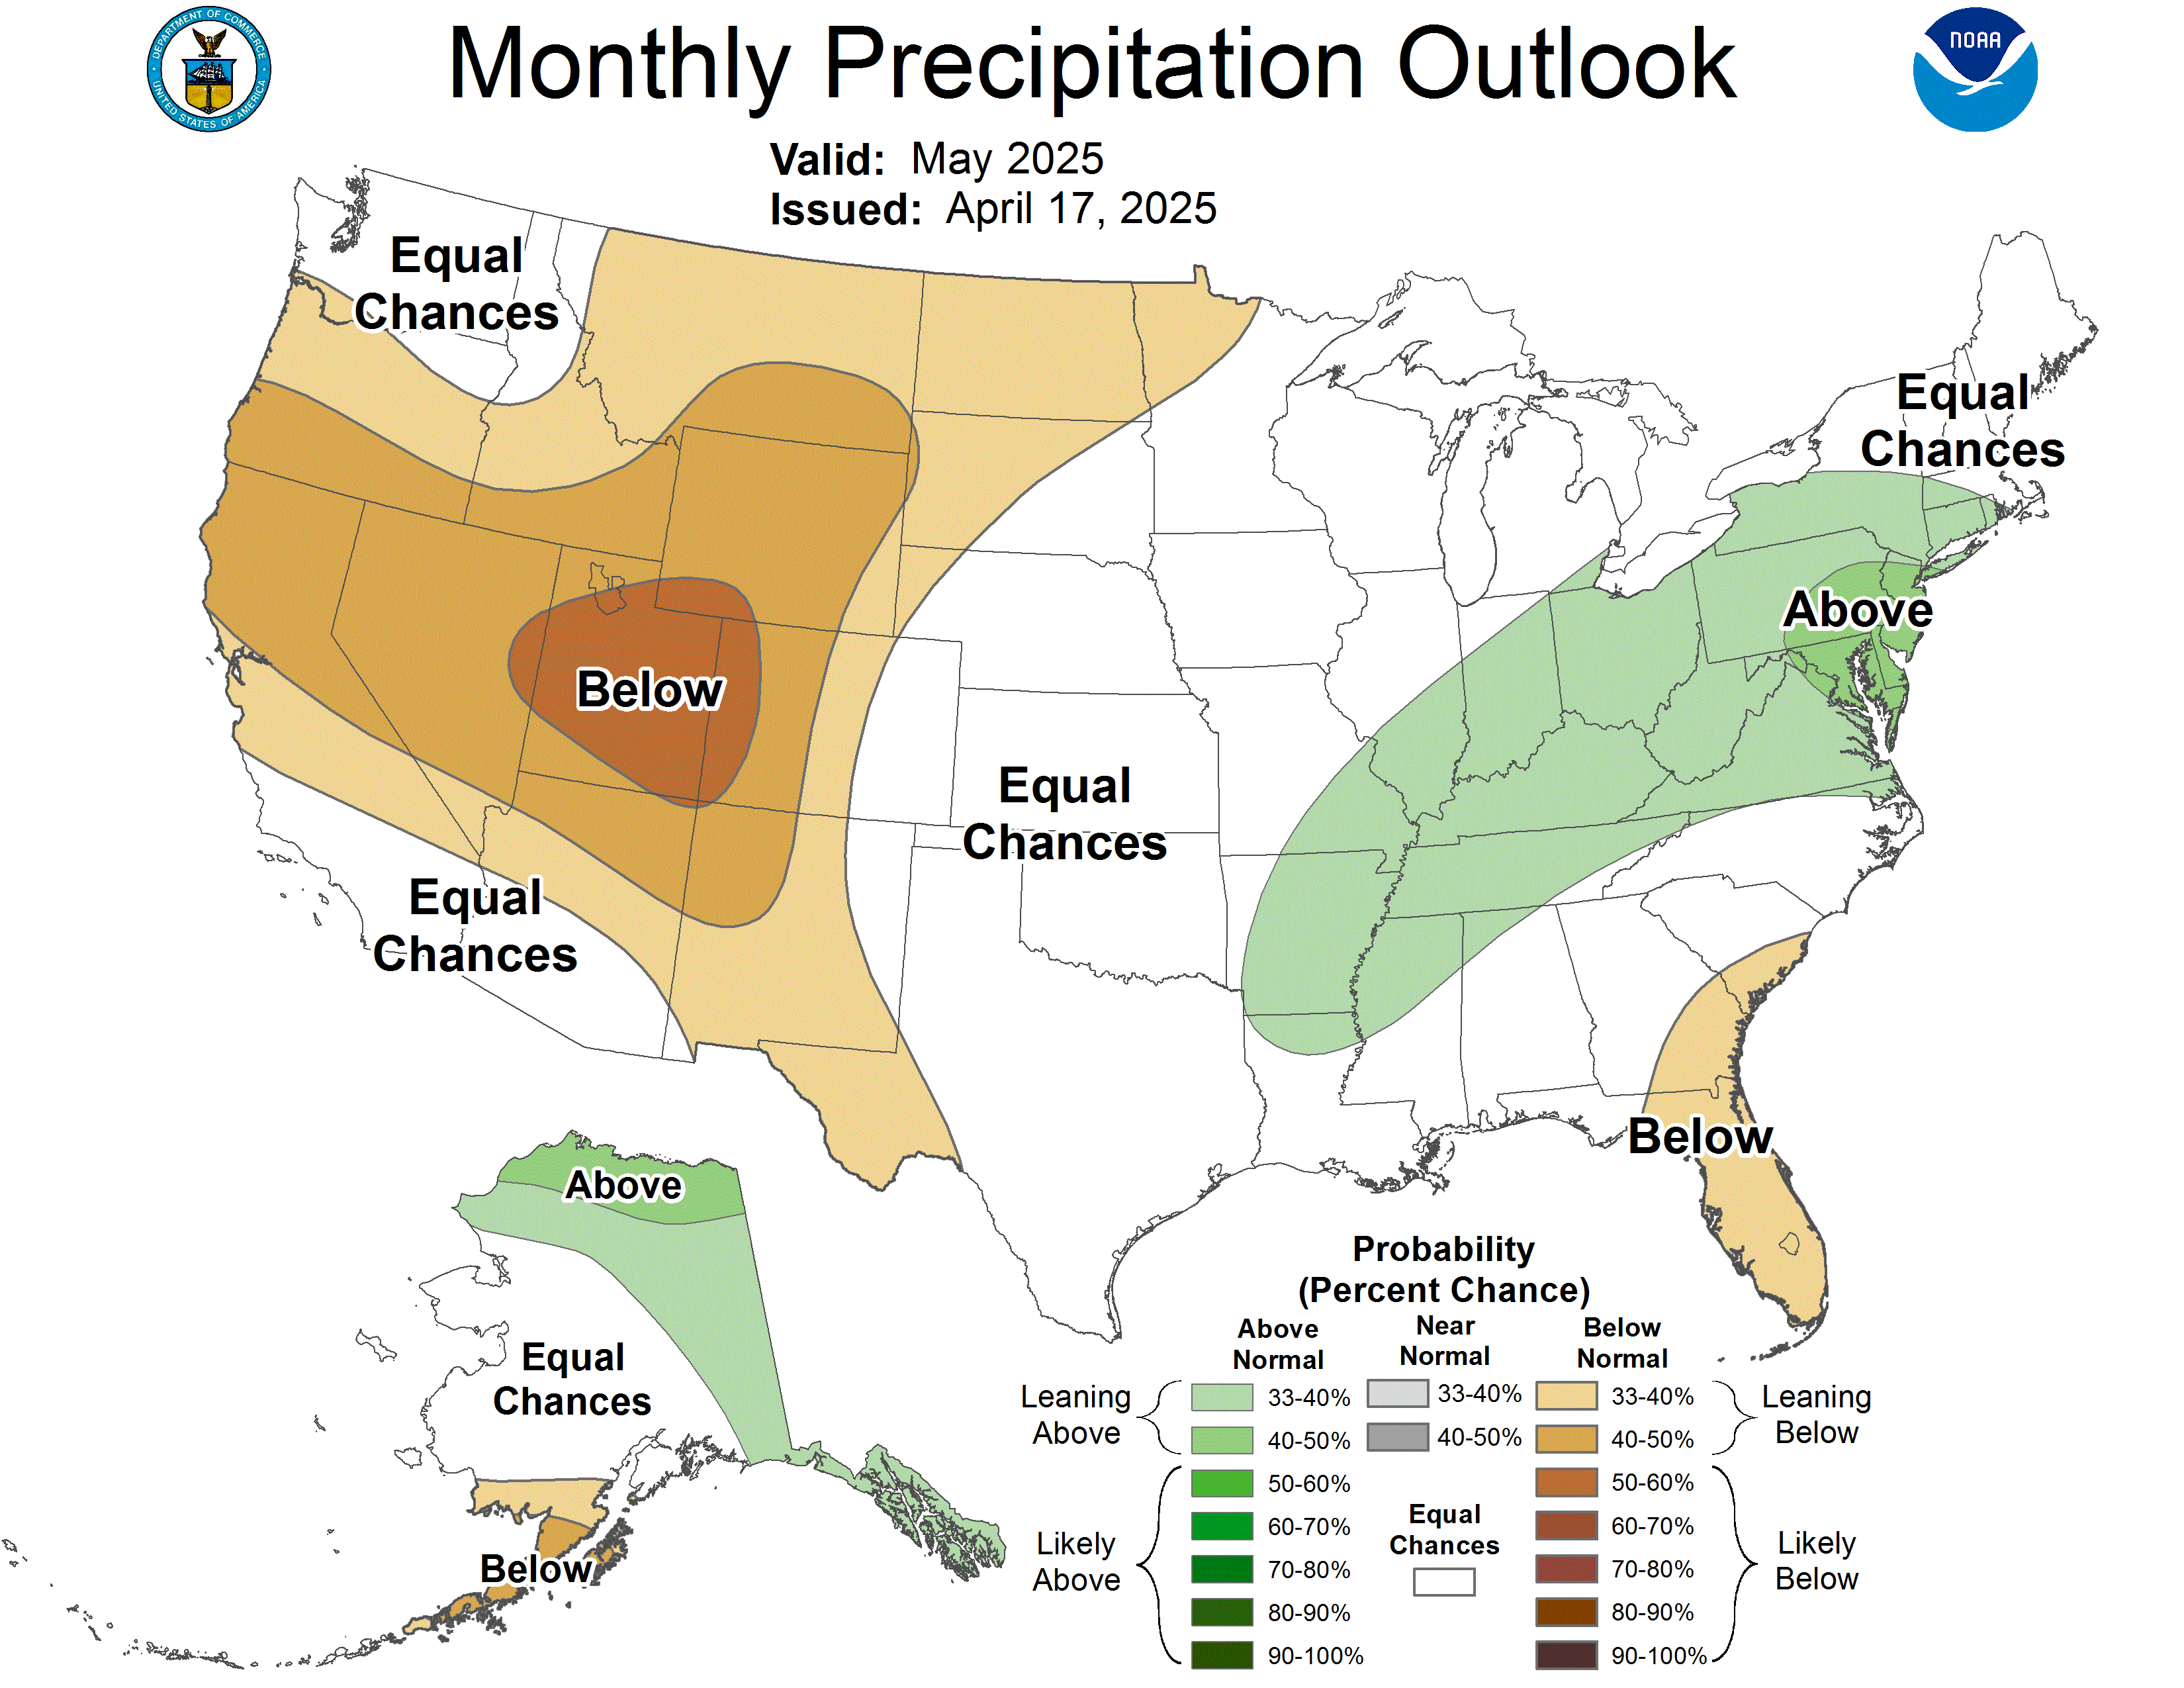
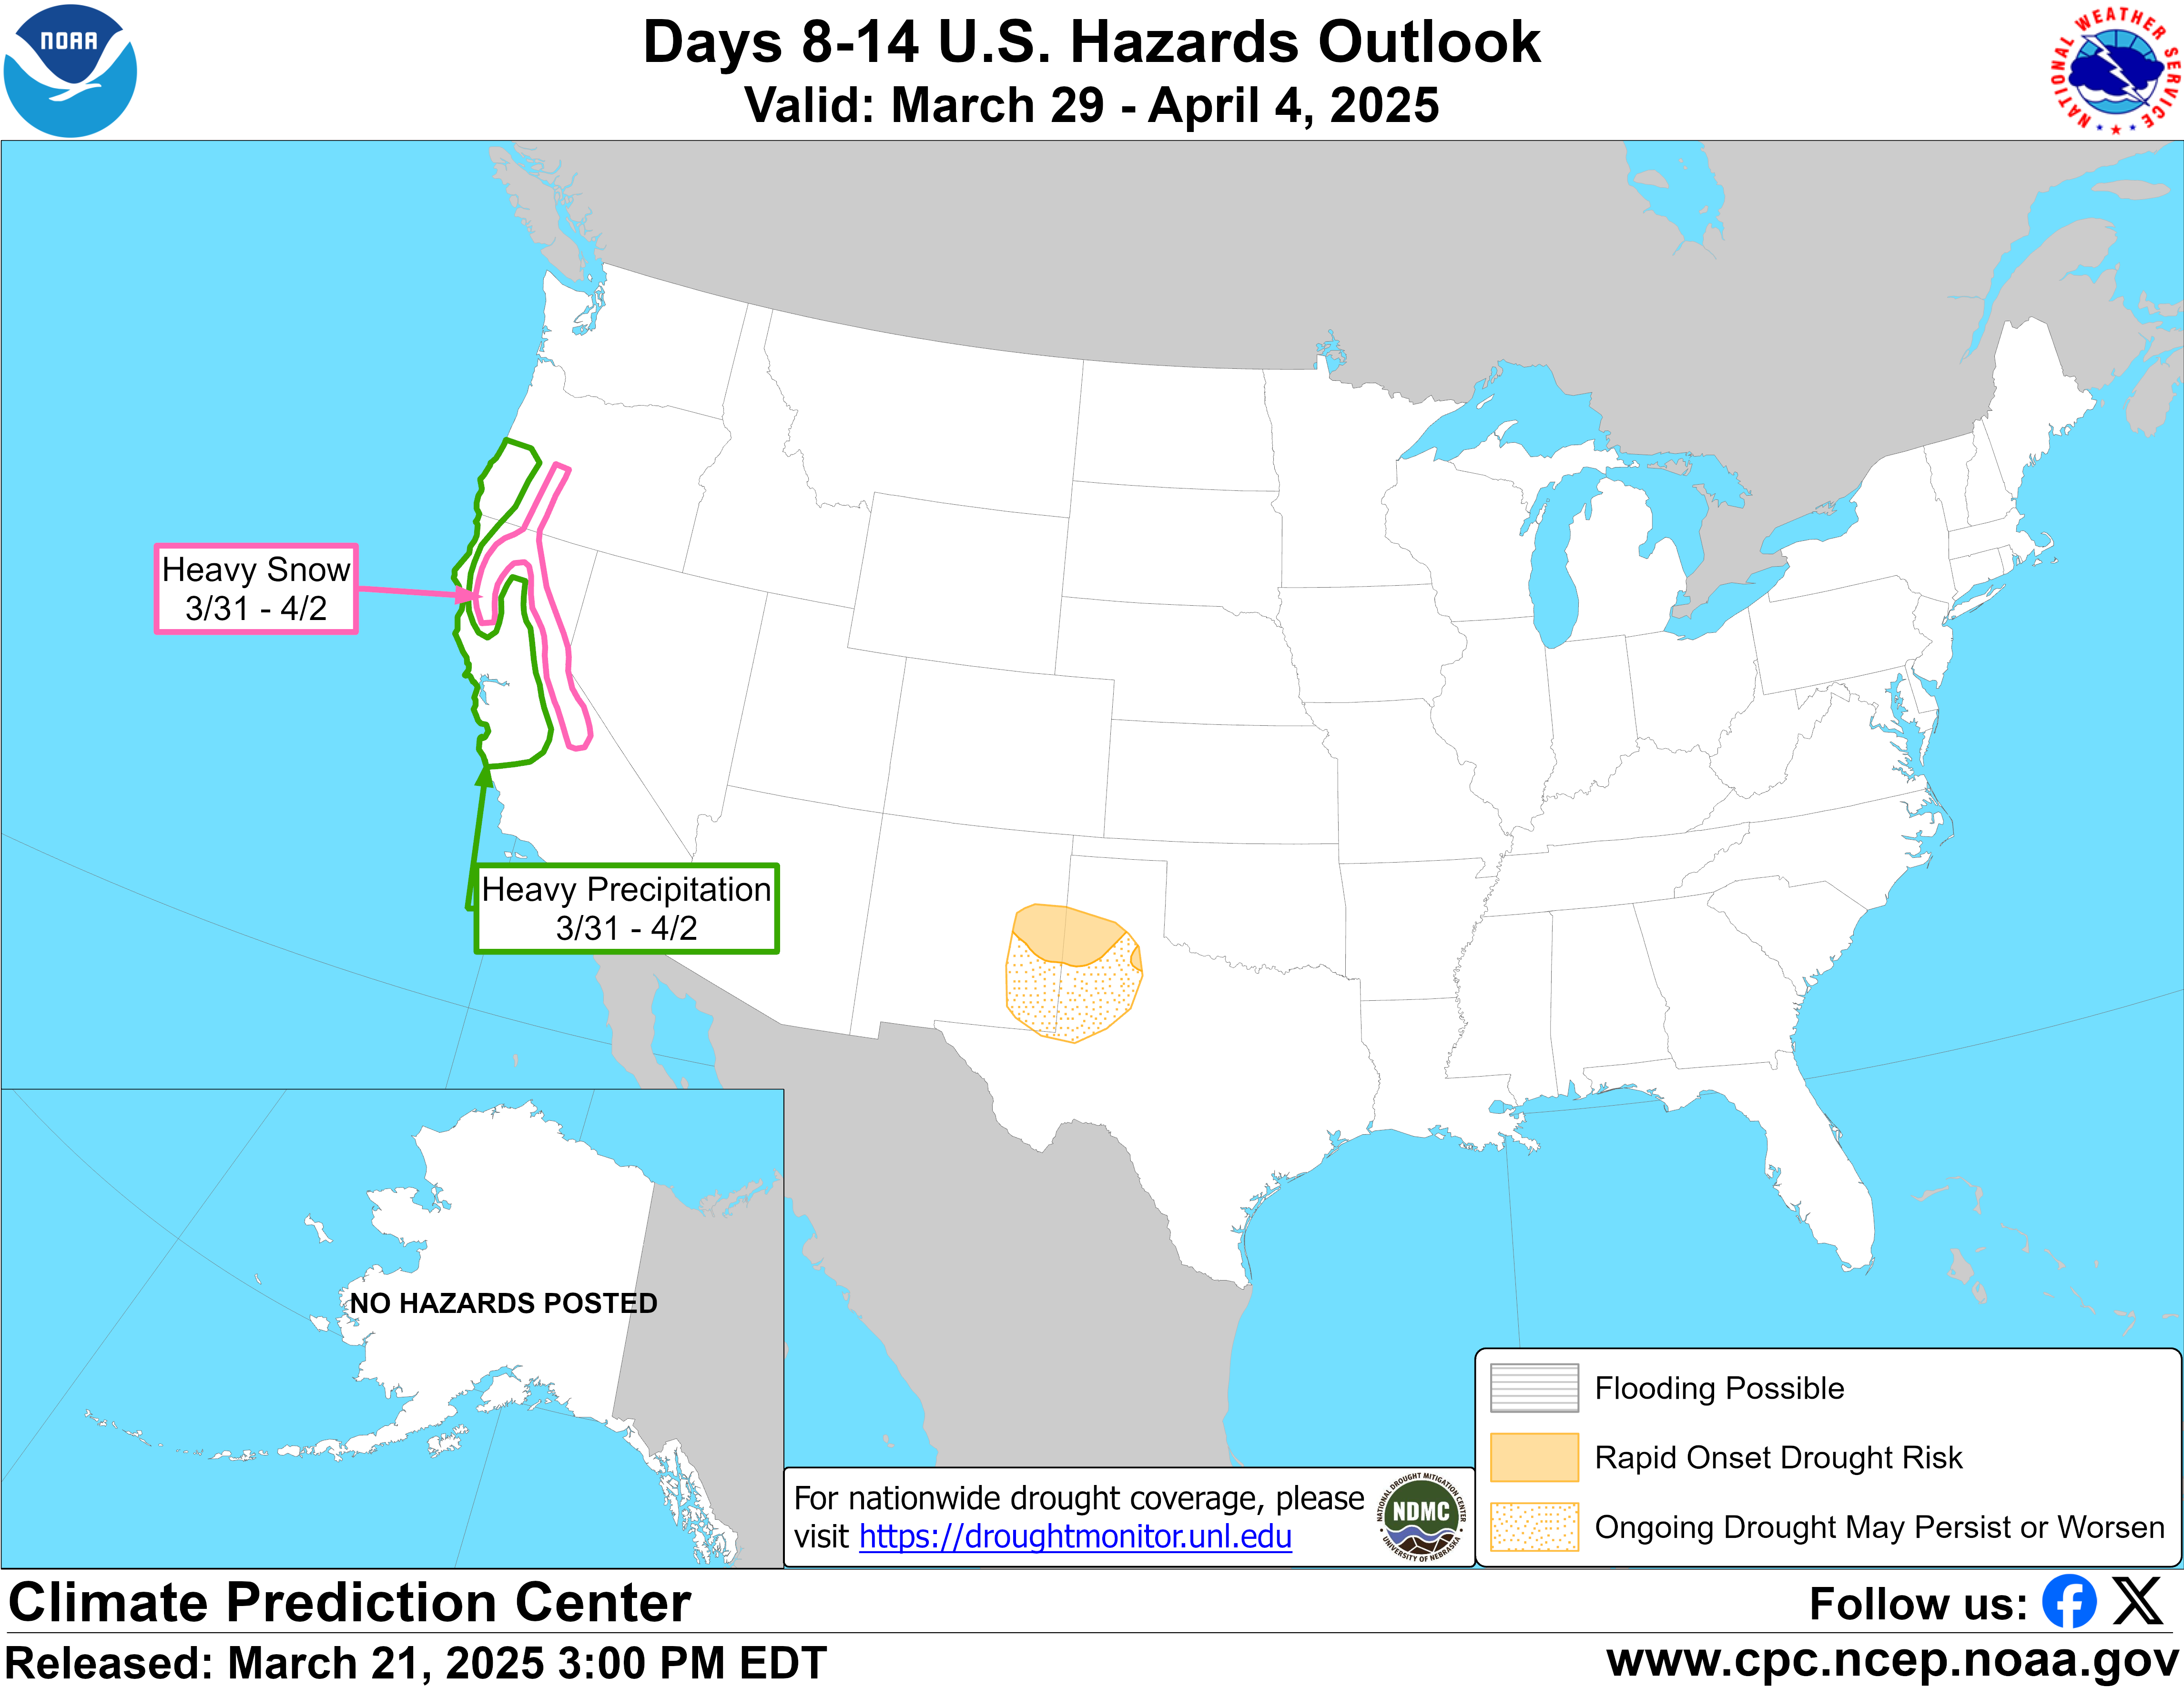
Radar (live loop) · Rain accumulation · Wind speed & gusts · Temperature · Cloud cover · Thunder & lightning · Snow depth · GOES-18 visible satellite · Infrared satellite · Water vapor · Pacific overview · NOAA radar (Reno CWA) · RainViewer animated radar · SPC severe weather outlook · Jet stream · QPF precipitation forecast · CPC 6-10 day temperature outlook · CPC 8-14 day precipitation outlook · ECMWF model viewer · GFS model viewer
Compare six of the models in our blend: GFS, ECMWF, ICON, GEM (Canadian), JMA (Japan) and ECMWF-AI, across precip type, snow accumulation, temperature, wind, 500mb heights, jet stream, CAPE instability, total precipitation, and surface pressure. Step through individual forecast hours or animate the full run. Useful for tracking incoming Sierra storms 7-10 days out.
Every chart from the Kerr Outlook deck, one by one. The model picker on the forecast tab changes these too.
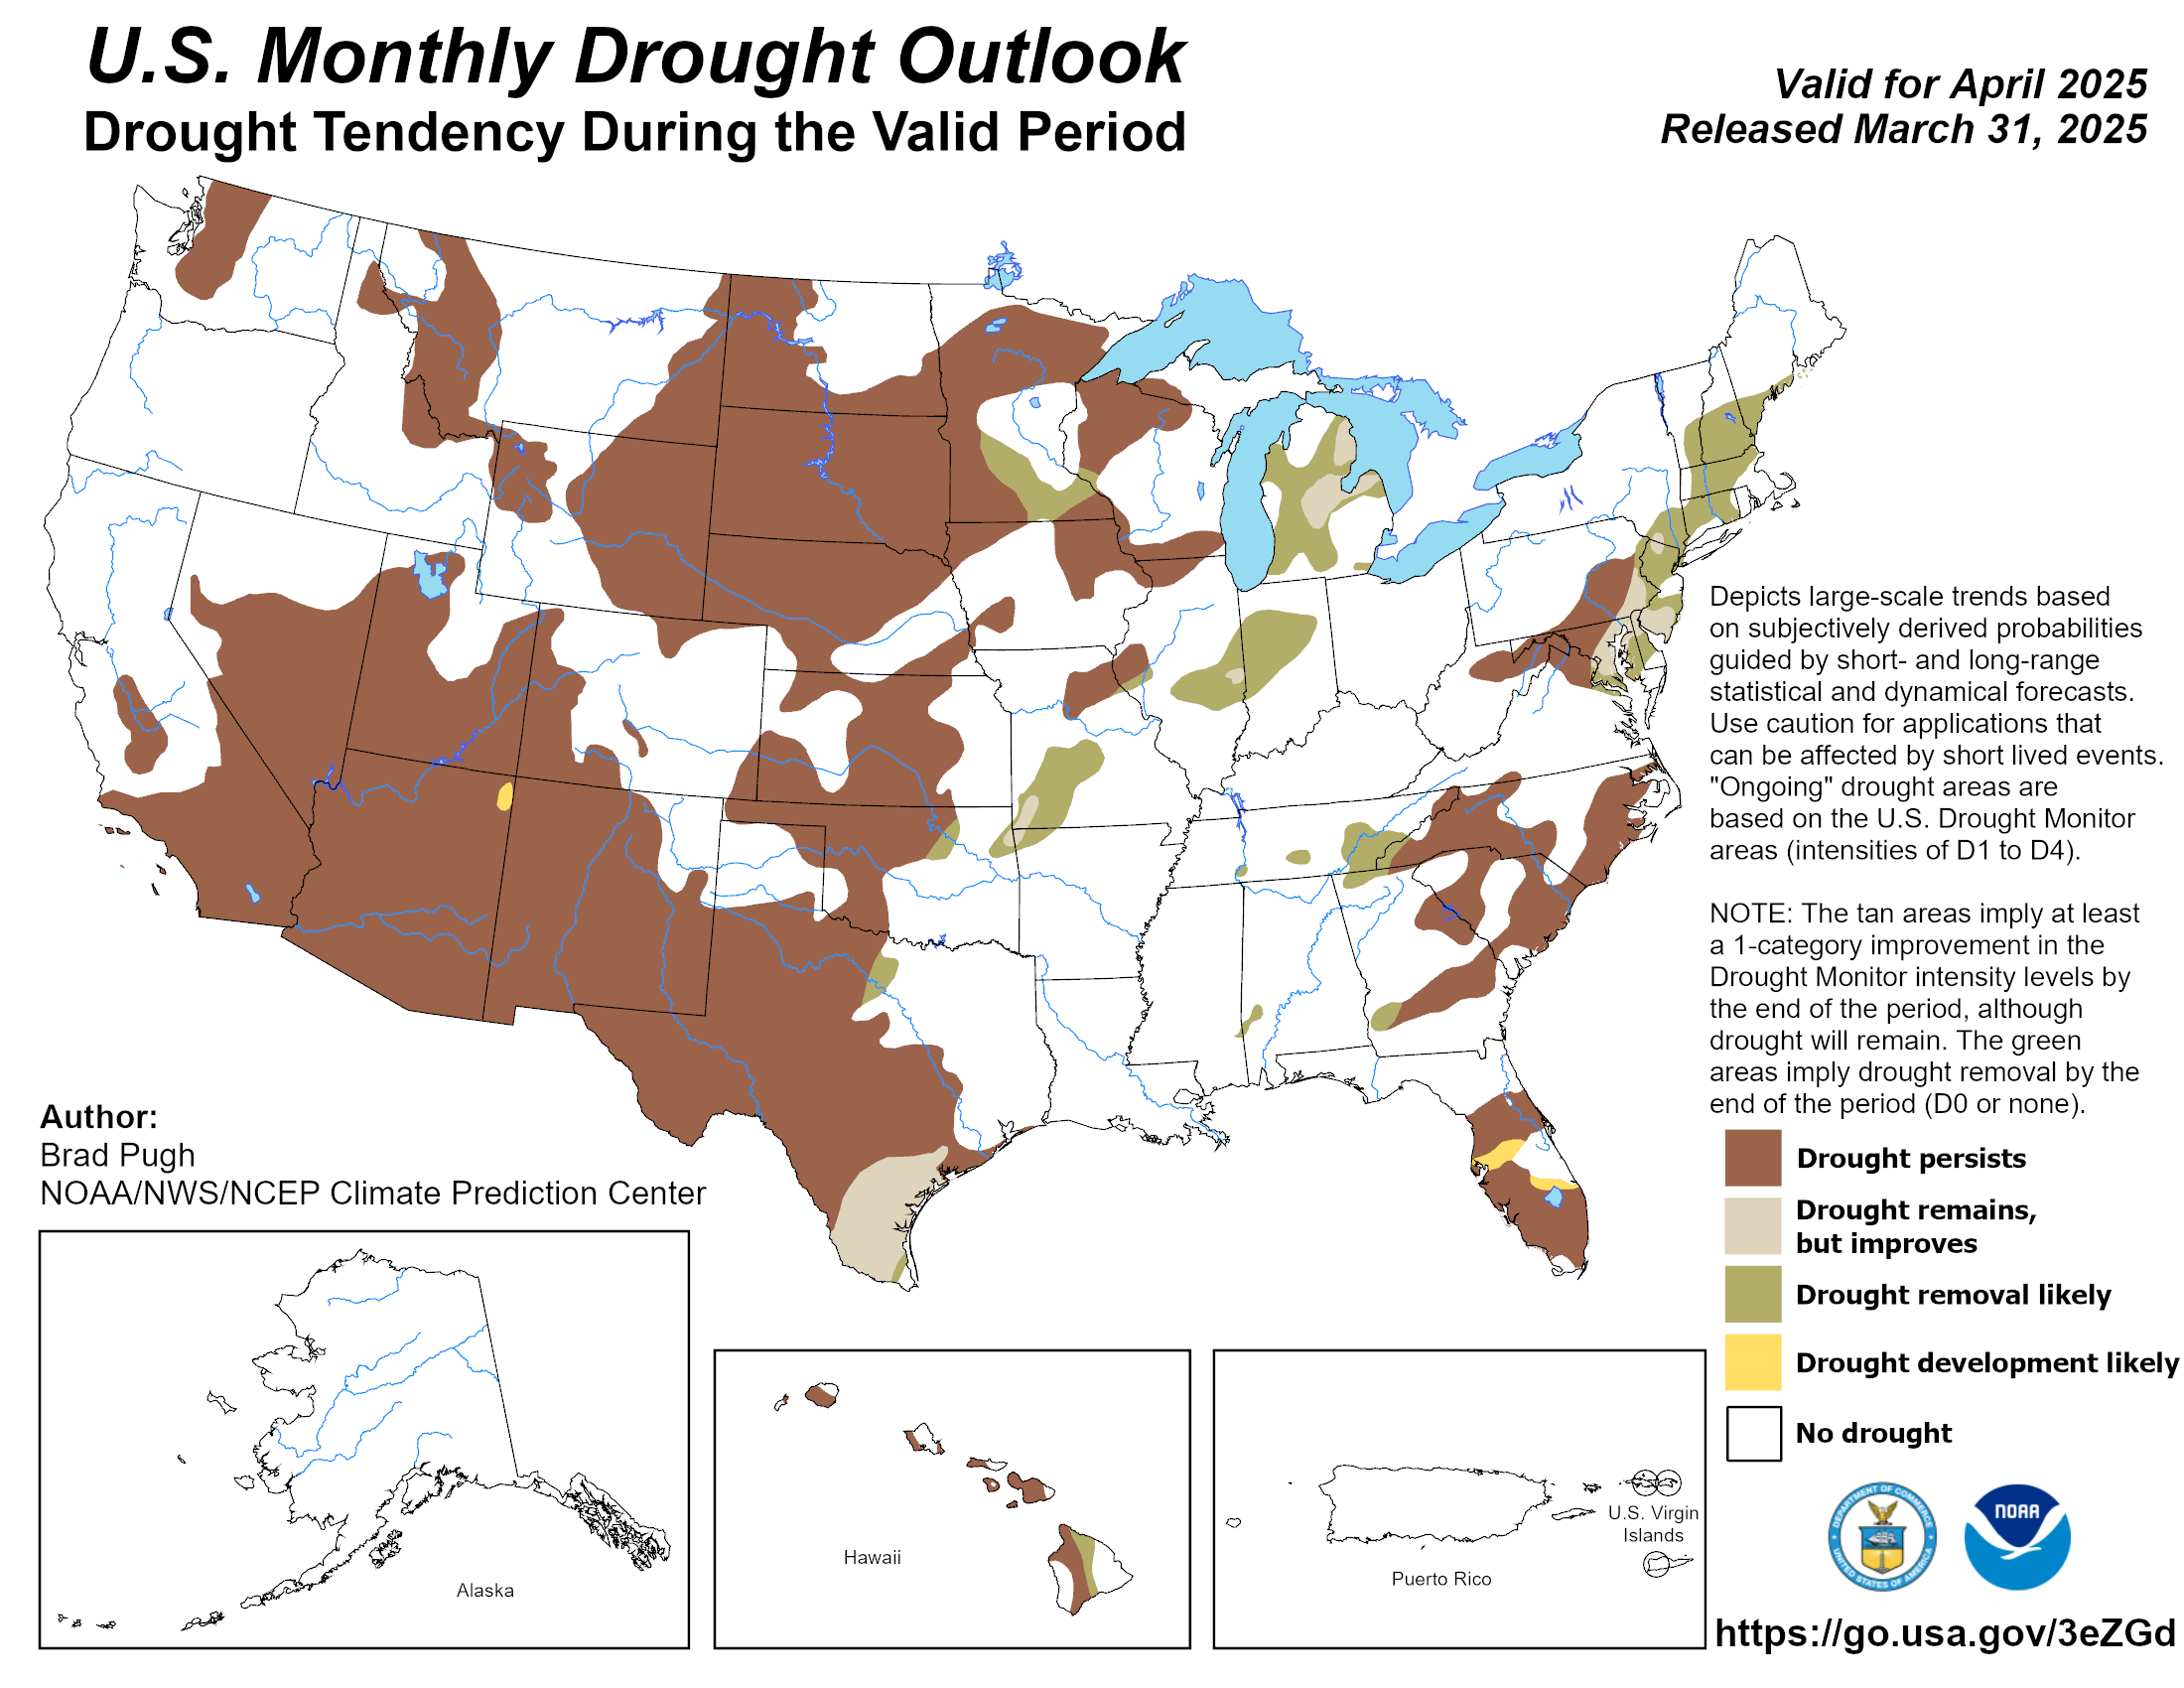
The season outlook and the latest NOAA El Niño numbers are written up in plain English in the Blog tab, dated to the NOAA update they come from, and refreshed when NOAA publishes a new one (second Thursday of each month). The seasonal and monthly maps above update themselves from NOAA.
| Level | What it means |
|---|---|
| R-1 | Chains or snow tires required on the drive axle. |
| R-2 | Chains required on all vehicles except four wheel drive with snow tires on all four wheels. |
| R-3 | Chains required on all vehicles, no exceptions. |
| Closed | No travel until Caltrans reopens the road. |
Truckee sits at about 5,817 feet. I-80 tops out at Donner Summit near 7,239 feet. That is roughly 1,400 feet of climbing in about 15 miles. Free air cools about 3.5 degrees Fahrenheit for every 1,000 feet, so the summit usually runs around 5 degrees colder than town, and it often gets more snow. The worst days are when the snow level sits between the two: Truckee gets rain, the summit gets snow, and the road in between ices up.
Road surface can freeze even when the air reads a few degrees above 32. Bridges, shaded corners and the Truckee River canyon freeze first. When the forecast shows a freeze overnight, assume black ice on the morning drive.
The live panel above shows what Caltrans has posted and updates every five minutes. For the official status use quickmap.dot.ca.gov or 1-800-427-7623.
R-1 is chains or snow tires on the drive axle. R-2 is chains on everything except four wheel drive with snow tires on all four wheels. R-3 is chains on every vehicle.
About 5 degrees on average from the roughly 1,400 foot elevation gap, with more snow, and the gap matters most when the snow level is between the two.
Every layer this forecast is built from. Tap one to see it live.
errolkerr.com/weather is a free weather intelligence platform for Truckee, California and the Sierra Nevada, built by Errol Kerr. It combines eight global forecast models (ECMWF IFS, ECMWF AIFS, GFS, ICON, JMA, GEM, UKMO and CMA) into a single ensemble view with a 16-day extended forecast, real-time storm-cell tracking with approach ETAs, 22 live Caltrans highway cameras along the I-80 corridor, upstream weather station data, USGS river streamflow readings, and 42+ interactive charts. The platform includes a self-learning back-checker that records forecast vs. actual conditions daily. Free forever, no signup required. Also see the GO/NO-GO crew weather decision tool and the storm forecast tracker.