
Third post in the Godzilla El Niño series. See the original post (June 27) and the July update.
We Said Pay Attention. The Ocean Just Screamed.
Back in June we looked at the SSTs and said a monster was loading up in the Pacific. In July, NOAA confirmed it and we told you the probabilities were climbing fast. We said the August update would be the next big checkpoint. Well, NOAA dropped their August 13 diagnostic discussion two days ago, and every single number got worse. Or better, depending on how you feel about powder.
This is no longer a forecast discussion. This is NOAA telling us the Pacific has rearranged itself in a way they've almost never seen, and there's a 69% chance this El Niño exceeds every event in their records going back to 1950. Not a small chance. Not an outlier scenario buried in the tail of a probability chart. The most likely outcome is now a historic El Niño. That is not the same as a guaranteed historic winter, but it loads the dice.
Everything Moved in the Wrong Direction
Let me lay out how fast this escalated. In our July post, the Niño 3.4 SST anomaly was +1.2°C. It's now +1.4°C on the monthly average and the weekly reading centered on July 15 hit +2.1°C, which puts it past the "very strong" threshold a full month earlier than anyone expected. The Niño 1+2 index near South America jumped from +2.7°C to +2.9°C. Niño 3 hit +1.7°C. That's major warming extending across the entire eastern and central tropical Pacific.
The probability of a very strong event went from 81% to over 90% for the autumn and winter window. For October through December specifically, it's 95%. That's not a forecast that hedges. That's a forecast that's telling you to get ready.
Ten Degrees Under the Surface
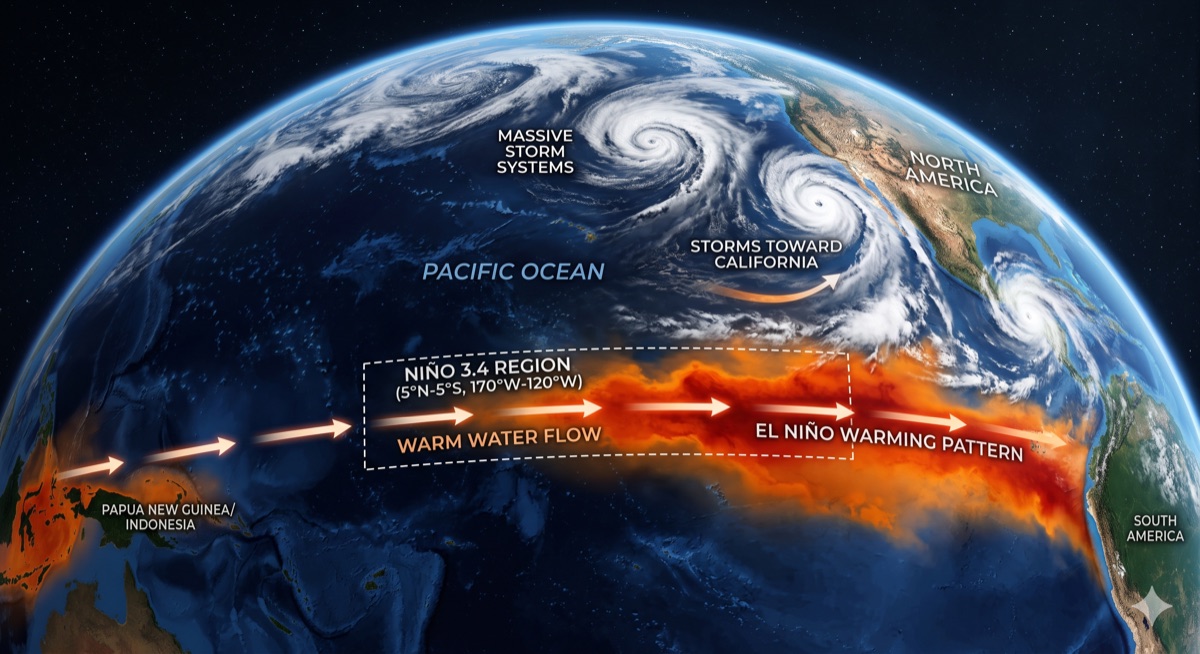
But the number that stopped me cold was what's happening beneath the water. In July we reported subsurface anomalies of +8°C. NOAA's August data shows localized anomalies of +10°C below the surface, between roughly 50 and 150 meters depth. That's where the thermocline has been shoved dramatically downward, and warm upper-ocean water has replaced colder water that should be there. The vertical structure of the entire Pacific has been rearranged.
Meteorologist Eric Webb said he'd never seen the mean warm pool displaced this far east and called the current configuration extraordinary compared to previous major El Niños. His comparison was to 1997-98, which until now was one of the strongest events in the entire modern record. The ocean right now is carrying more heat, distributed deeper, and pushed farther east than 1997 at the same stage.
In excavation, we have a saying: once the grade breaks, you're committed. The Pacific's grade broke months ago. The warm water is deep, it's massive, and there is no mechanism to turn it around before winter. This thing runs on its own fuel now.
The Atmosphere Locked In
Here's the part that turned this from serious to locked. A major El Niño doesn't run on warm water alone. It needs the atmosphere to couple with the ocean, to form a feedback loop where westerly winds push warm water east, the warm water drives more thunderstorms, and those thunderstorms weaken the trade winds even further. NOAA's August report confirms that coupling is now fully in place.
Low-level westerly wind anomalies now extend from the western Pacific into the east-central Pacific. Tropical convection has shifted east, away from Indonesia and into the central and eastern basin. The Southern Oscillation Index dropped to nearly two standard deviations below normal. The atmosphere isn't just responding to the ocean anymore. It's reinforcing it. It's like watching a loaded excavator on a slope: once it starts sliding, the weight feeds the motion.

What 69% Historic Means
NOAA uses something called RONI, the Relative Oceanic Niño Index, which measures the Niño 3.4 temperature relative to the broader tropical ocean. It's a tougher standard than raw SST because the central Pacific has to stand out even against a generally warm background. A RONI value of +2.5°C or higher during October through December would exceed every El Niño in their records since 1950. That means bigger than 1982-83 (+2.2°C peak), bigger than 1997-98 (+2.4°C), bigger than 2015-16 (+2.6°C). NOAA just put a 69% probability on that outcome.
That's not an edge case sitting at the far end of a probability distribution. That's the most likely bucket in the forecast. Weak and moderate outcomes have essentially disappeared from the late-year outlook. The overwhelming majority of the October through December probability sits inside "very strong" or above. The forecast has crossed into territory where the record-breaking scenario is more likely than not.
Look at that chart. Every major El Niño since 1950 is on there. The dashed bar at +2.5°C is the RONI threshold NOAA says has a 69% chance of being reached. The solid red bar on the right is the high-end model projection. This event isn't trying to join the club. It's trying to build a new floor above the old ceiling.
What This Means for Tahoe and the Sierra
I've been around enough Sierra winters to know that forecasts don't shovel your driveway. But I've also been around enough to know what the signal looks like when a big one is coming, and this signal is deafening.
When the Niño 3.4 pushes past +2.0°C, the subtropical jet stream gets shoved south and locks onto California like a fire hose. Atmospheric rivers stack. Storm systems queue up in the Pacific and take turns dumping on the Sierra for weeks at a time. In 1982-83, Norden near Donner Pass recorded nearly 804 inches. It snowed every weekend from mid-January to mid-May. In 1997-98, Squaw Valley got 68 inches in a single 24-hour period on New Year's Day. Lake Tahoe rose 6.5 feet from runoff alone.
Those were +2.2°C and +2.4°C events. The weekly Niño 3.4 just hit +2.1°C in mid-July, and we haven't even reached the traditional intensification window yet. If NOAA's 69% scenario plays out and this thing peaks above +2.5°C on the RONI scale, we're looking at conditions that exceed the template for every big snow year in living memory. Five hundred inches at elevation would be conservative. Six hundred or more is on the table.
The ski season could start in October and run through July. Early-season atmospheric rivers could stack before Halloween. The backcountry avalanche hazard will be extreme and sustained. I grew up on the Squaw Valley Ski Team and carried the Jamaican flag in Vancouver. I've skied everywhere. And I have never seen a setup this aggressive, with this much subsurface fuel, this far ahead of winter.
What Changed Since July
For everyone following the series, here's the escalation in plain numbers. Niño 3.4 monthly went from +1.2°C to +1.4°C. The weekly reading blew past +2.0°C to hit +2.1°C. Niño 1+2 climbed from +2.7°C to +2.9°C. Subsurface anomalies jumped from +8°C to +10°C. The "very strong" probability went from 81% to 95% for October through December. And NOAA added an entirely new category to the discussion: a 69% chance of exceeding every event in their 76 years of records. The atmosphere fully coupled with the ocean. The Southern Oscillation Index dropped to two standard deviations below normal. Every major signal intensified in one month.
The warm pool, which normally sits near Indonesia, has been displaced farther east than meteorologists have ever observed at this stage. Temperatures approaching 30°C are reaching down to about 100 meters depth near 150°W in the central Pacific. That's extraordinary. That water is the fuel tank, and it's been moved directly into the firing position for the storm track that hits California.
Get Ready
The next NOAA diagnostic discussion is scheduled for September 10. If the current trajectory holds, September numbers will lock in the October through December outlook at the very strong level and the historic probability will likely climb further. Another round of westerly wind anomalies is forecast for late August, which would push more warm water east and deepen the thermocline further.
Here's my list. Season pass secured. Avalanche gear serviced. Real chains, not cables, for the truck. Stock the pantry deep. If you're a backcountry skier, take the AIARE course, because a season like this is an avalanche season first and a powder season second. If you run equipment at elevation like I do, start planning now for job delays, road closures, and snow removal that doesn't stop.
I run a crew at 6,000 feet. I know what a big winter does to a schedule and a budget. I also know what a 600-inch winter looks like from a chairlift, and it's the reason I live here. The odds now favor a big one, and the Pacific is telling us how strong this El Niño could get.
Tracking this since March. Next update when NOAA's September 10 data drops. The monster isn't slowing down.
- NOAA CPC ENSO Diagnostic Discussion — 13 August 2026
- NOAA CPC ENSO Strength Probabilities — August 2026
- ENSO Evolution, Status & Predictions (PDF) — NOAA CPC
- IRI/Columbia ENSO Forecast — Multi-model ensemble
- Above The Norm: NOAA Issues Extraordinary El Niño Update — August 13, 2026
- StormBag: Super El Niño 2026-27 Forecast