
UPDATE to the original Godzilla El Niño post (June 27, 2026)
We Called It. NOAA Just Made It Official.
Three weeks ago, we looked at the data and said the monster was coming. The SSTs were climbing. The Kelvin wave was propagating. All 24 models agreed. We published the Godzilla El Niño post and told you to pay attention.
NOAA just made it official. They've issued a formal El Niño Advisory, meaning conditions aren't developing, they aren't emerging, they are present. Right now. The tropical Pacific has crossed the threshold and there is no ambiguity left. The monster is real.
The Numbers Have Gone Vertical
When we wrote the original post, the chance of a very strong El Niño was 63%. Here's where the probabilities stand now:

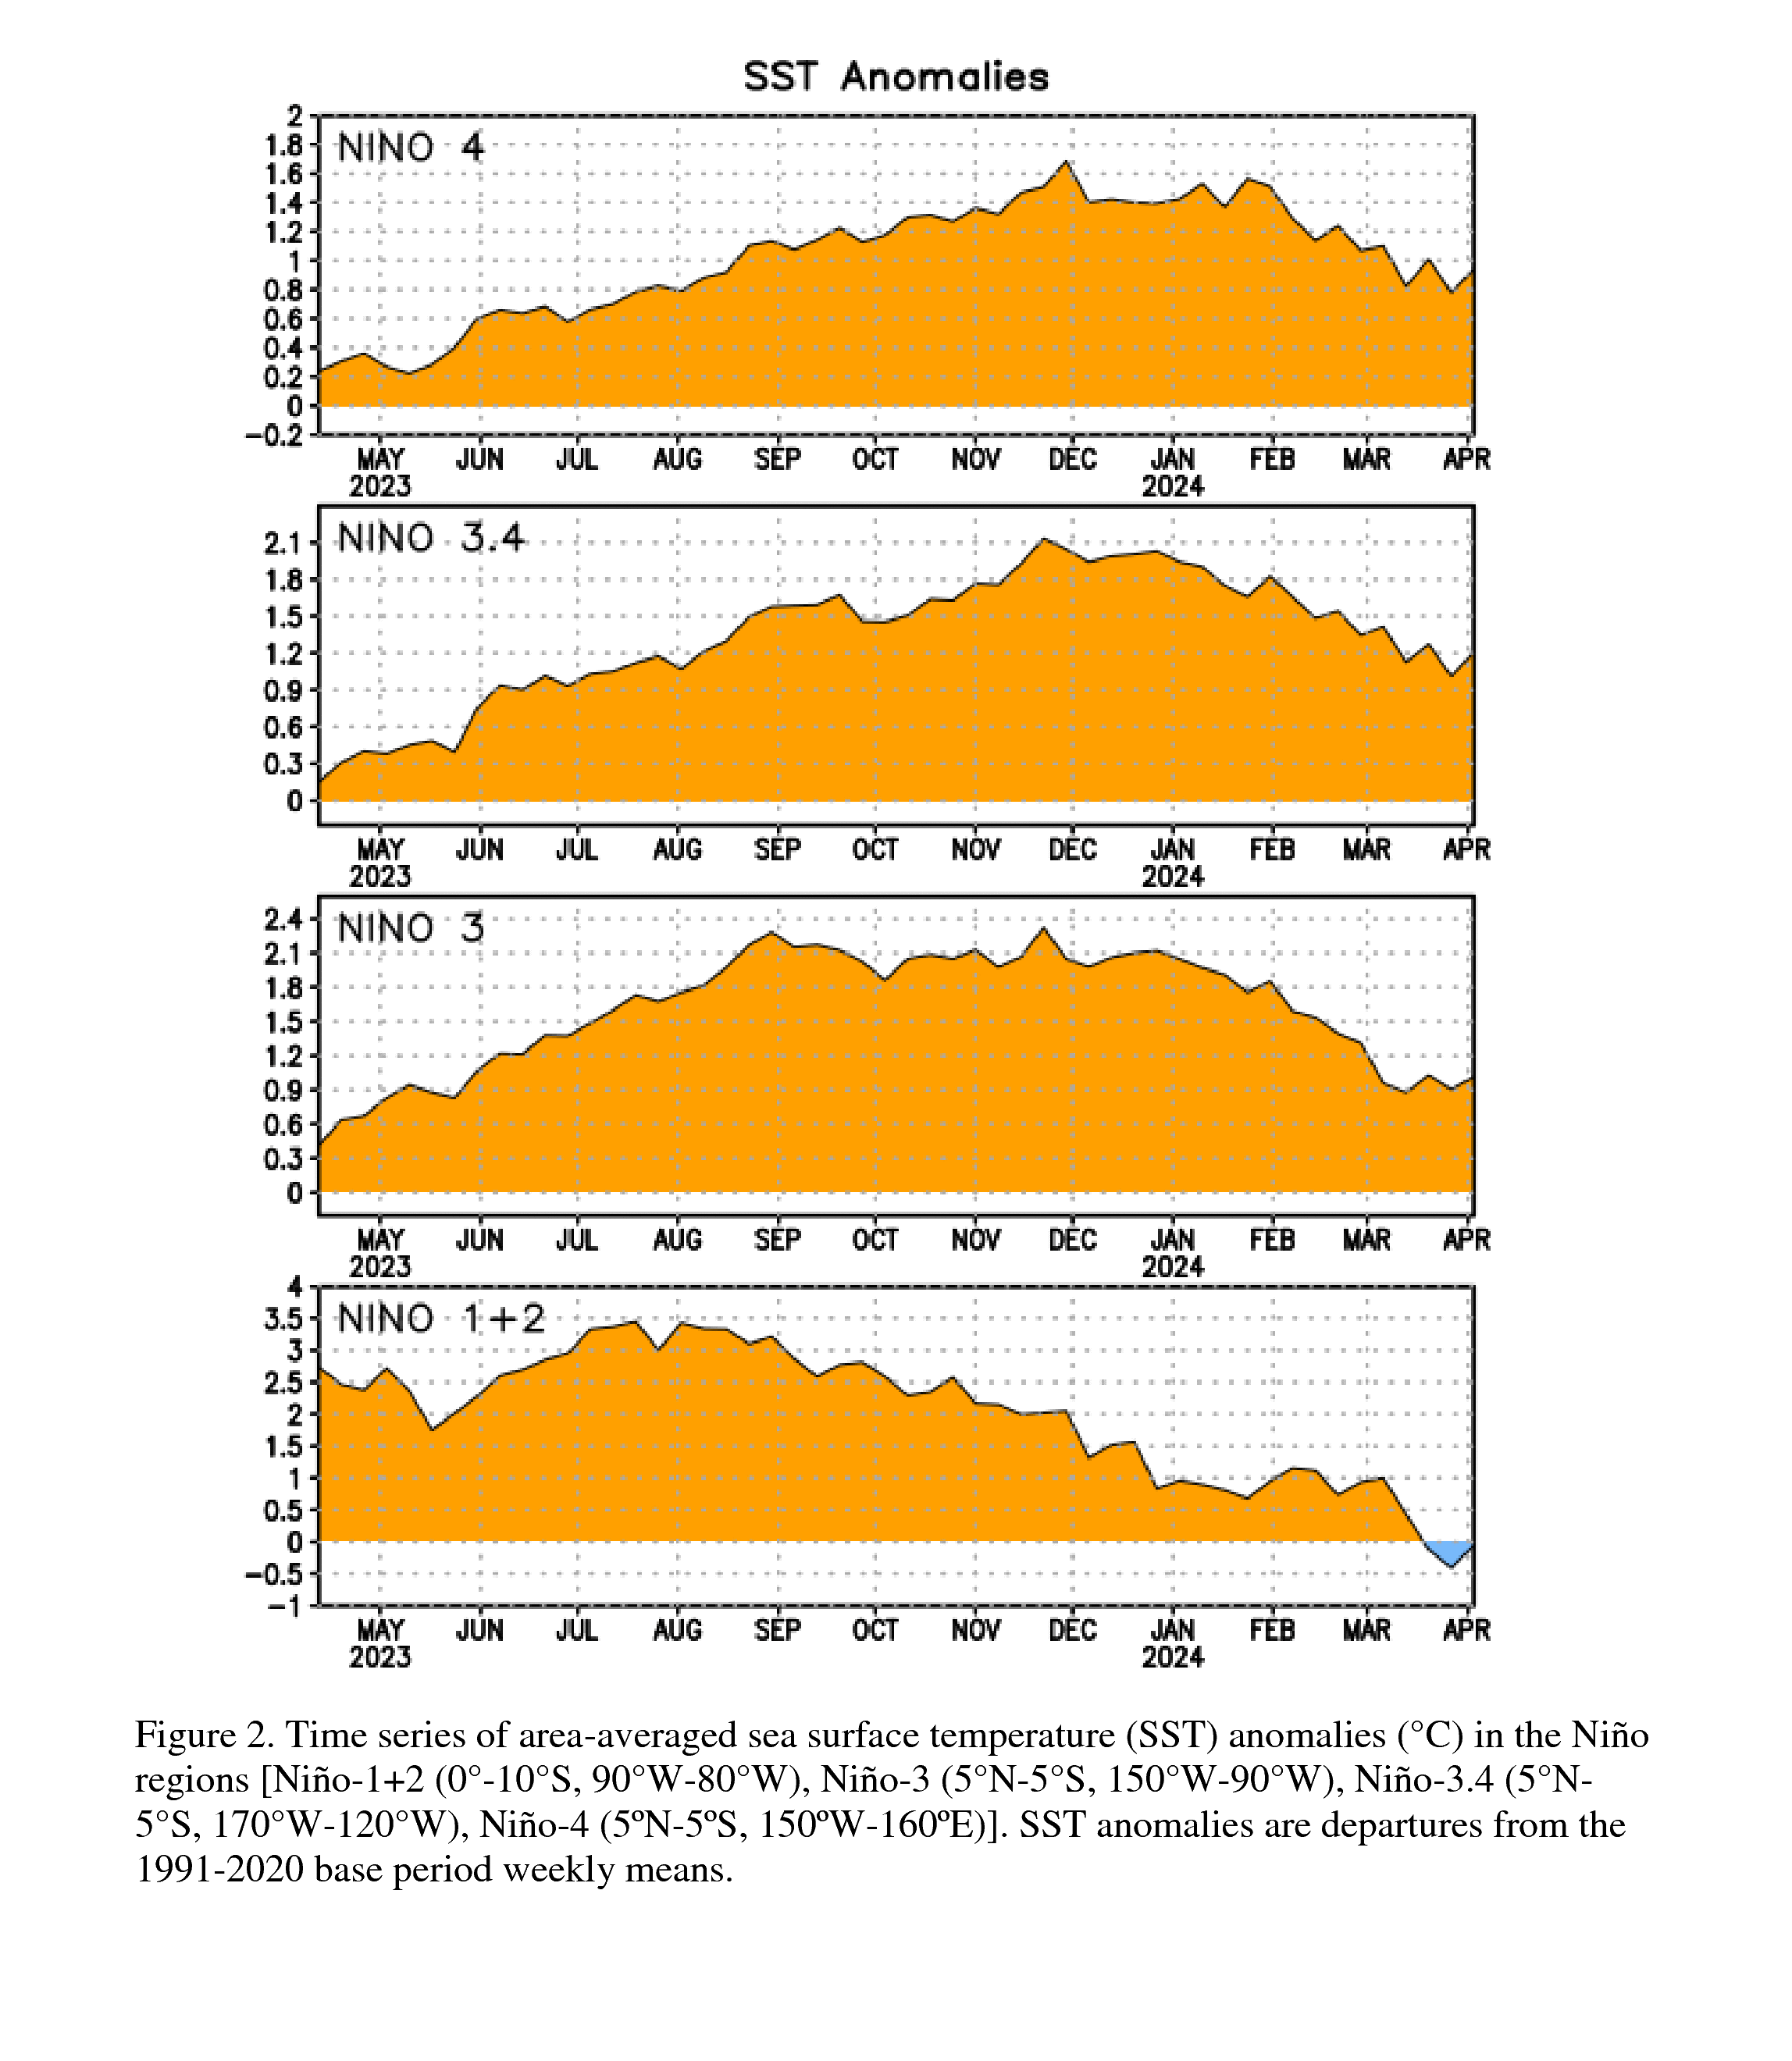
The Niño 3.4 SST anomaly is at +1.2°C above average and climbing. The easternmost Niño-1+2 index has already hit +2.7°C. All 24 IRI/Columbia forecasting models are in strong agreement: this event is strengthening, not fading. Weather.com is calling it one that could “rank among the largest events in historical record since 1950.”
“Very strong” El Niño means the Niño 3.4 index exceeds +2.0°C above average. NOAA has only recorded a handful of events that strong since 1950. Models now project we blow past that threshold by September, and keep climbing.
The Kelvin Wave: The Engine Under the Surface
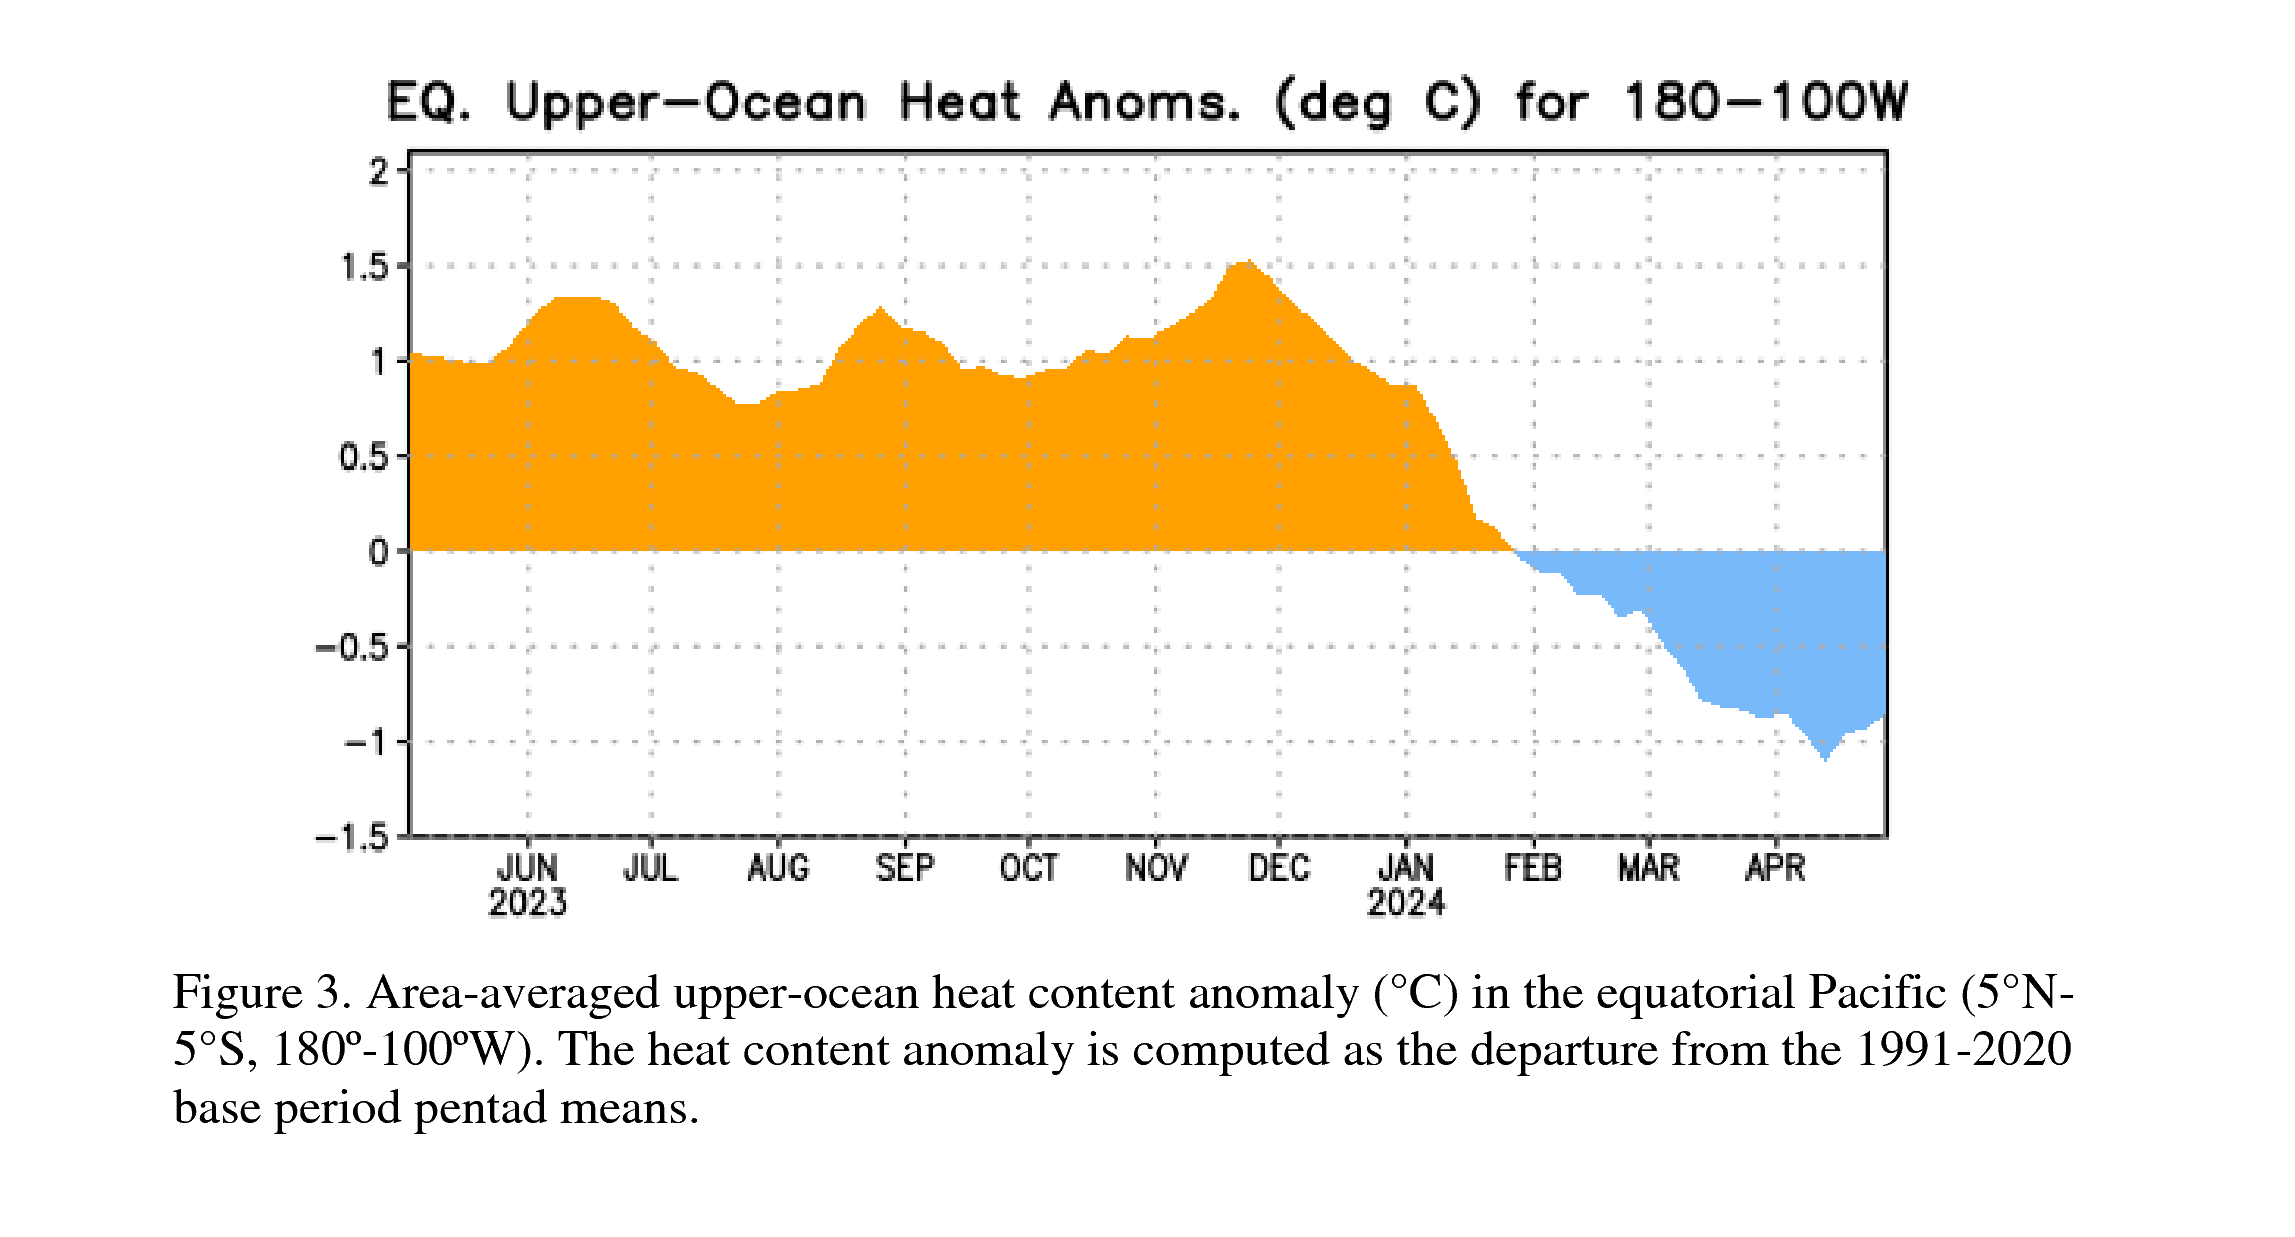
Here's what most weather coverage misses. Beneath the surface, a massive downwelling Kelvin wave with subsurface temperature anomalies of +8°C between 50 and 250 meters depth has propagated east across the equatorial Pacific. That warm water is now surfacing in the eastern Pacific, fueling continued SST growth. This Kelvin wave is running warmer than the 1997-98 event at the same stage. The engine is running and nobody can shut it off.
Every Model Agrees: This Is Going Up
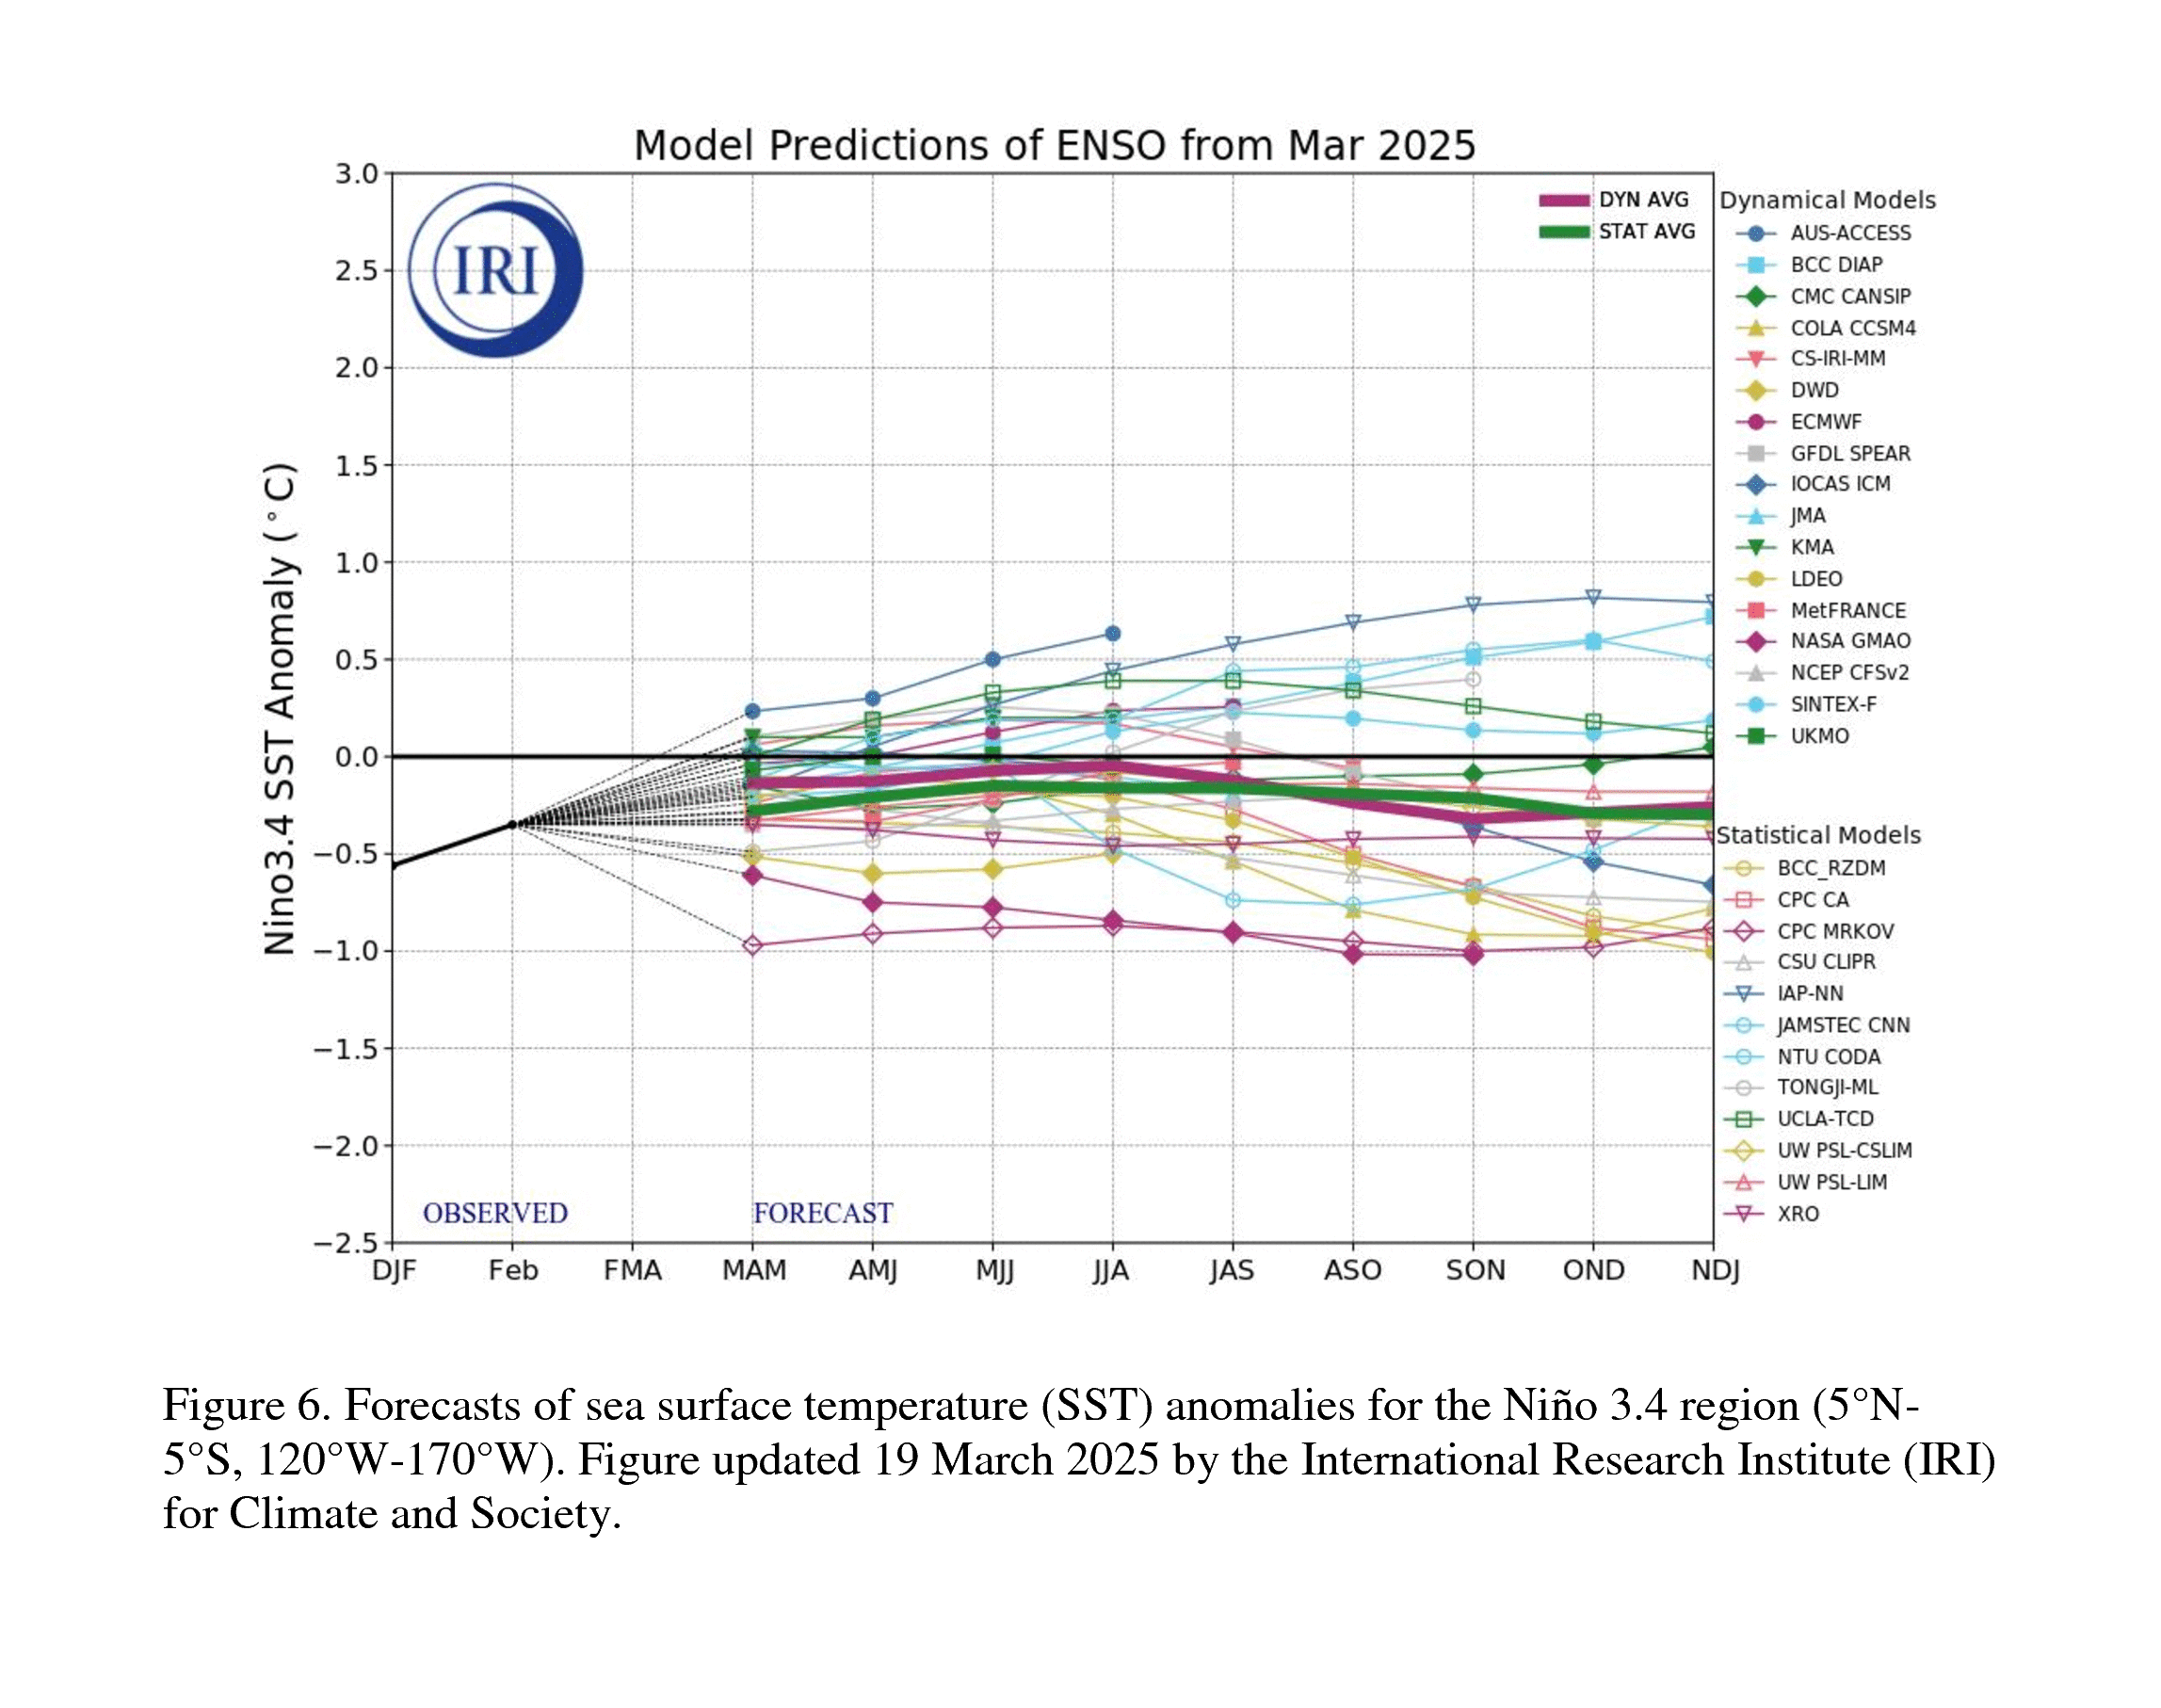
Look at the forecast plume below. Every spaghetti line goes up. The NCEP CFSv2, the NMME ensemble, and the IRI multi-model all agree: El Niño intensifies through 2026 and persists through early 2027. Peak median projections have climbed from +2.8°C in March to +3.6°C in the July runs. ECMWF's latest ensemble projects peak SST anomalies of +3°C (median) by December, with high-end scenarios reaching +4°C.
Bigger Than 1997. Bigger Than 2015. Maybe Bigger Than Anything.
Let's put this in context. The three biggest El Niños in the modern record peaked at +2.2°C (1982-83), +2.4°C (1997-98), and +2.6°C (2015-16). Models are now projecting +3.0°C above average as early as September, three months before the traditional winter peak. If that verifies, this isn't just a strong El Niño. This is something that rewrites the record books.
And we're stacking this on top of the hottest ocean baseline in recorded history. The equatorial Pacific hit 26.99°C in April. The Kelvin wave we tracked in June is still delivering warm water eastward, with subsurface anomalies running warmer than 1997-98 at the same stage.
What This Means for Tahoe: 400-600+ Inches
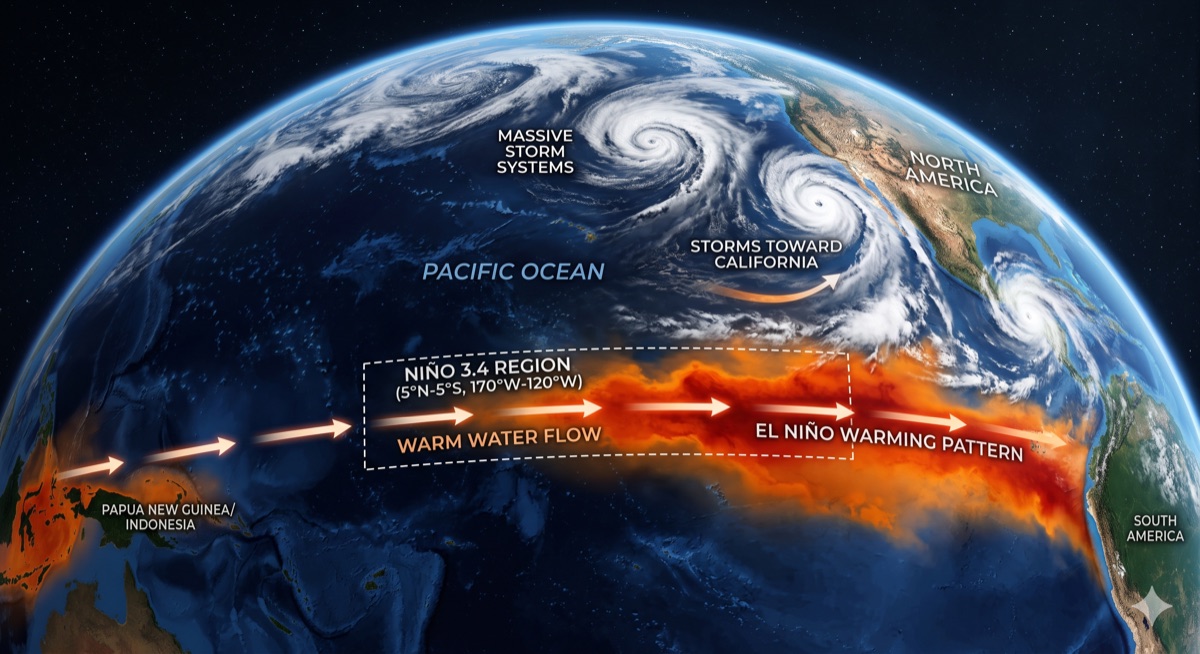
We said it in the original post: regular El Niños are a gamble for Tahoe. Monster El Niños deliver. With an 81% chance of very strong and 80%+ chance of super status, we're firmly in monster territory. Here's what history tells us about seasons like this:
1982-83: Norden near Donner Pass recorded nearly 804 inches. Snowpack hit 15 feet by February. Atmospheric rivers stacked for weeks. It snowed every single weekend from January 15 to May 15.
1997-98: Snowpack exceeded 200% of average. Squaw Valley reported 68 inches in 24 hours on New Year's Day. Lake Tahoe rose 6.5 feet from runoff.
If +3.0°C projections verify, both of those seasons become the floor, not the ceiling. We're talking about above-average precipitation, potential for 400-600+ inch snowfall seasons at elevation, extended atmospheric river events, storm cycles that stack for weeks, rain-on-snow at lake level, and pure powder at the peaks. Early-season storms could hit by late October. The ski season could run November through July.
What We're Watching Next
The August NOAA update is the next big checkpoint. If SSTs keep climbing at this rate through August, the October-December projections get locked in. We'll also be watching for the first atmospheric river setup of the fall. Historically, monster El Niños announce themselves with an early-season bomb before Halloween.
I carried the Jamaican flag at the 2010 Olympics. I've skied on every continent. I run heavy equipment at 6,000 feet for a living and ski 60+ days a year. I've been tracking this since March, and I've never seen models this aggressive, this unified, this early in the season.
The original Godzilla post has the full baseline data, the SST trajectory chart, and the historical snowfall comparisons. This update confirms what the ocean already told us: the monster is real, and it's bigger than we thought.
Get your season pass. Service your avalanche gear. Buy real tire chains. Stock the pantry. If you're in the backcountry, take the AIARE course. A 600-inch season is an avalanche season.
We'll keep tracking this. Next update when the August NOAA data drops (scheduled for August 13). Bookmark the page. The monster isn't slowing down.
- NOAA CPC ENSO Diagnostic Discussion — 9 July 2026
- NOAA CPC ENSO Strength Probabilities — July 2026
- ENSO Evolution, Status & Predictions (PDF) — NOAA CPC
- IRI/Columbia ENSO Forecast — Multi-model ensemble
- Weather.com: Super El Niño Strengthening — July 2026
- The Watchers: 81% Chance Strongest on Record